Résumés
Abstract
Wastewater effluents can be treated by an integrated membrane system combining membrane bioreactor (MBR) and reverse osmosis (RO) for effective removal of micropollutants in the field of high-quality water reuse. However, discharging the RO concentrate waste stream directly into the natural environment could lead to serious problems due to the toxic components contained in the concentrates (micropollutants, salts, organic matter). A possible solution could be the recirculation of RO concentrate waste to the MBR. However, such an operation should be studied in detail since the recirculation of non-biodegradable organic matter or high concentrations of salts and micropollutants could directly or indirectly contribute to MBR membrane fouling and modification of the biodegradation activity. In this context, the work reported here focused on the recirculation of such concentrates in an MBR, paying specific attention to MBR membrane fouling. Lab-scale experiments were performed on a continuous MBR-RO treatment line with RO concentrate recirculation. The main goal was to determine the recovery of the RO unit and of the global process that maintained good process performance in terms of biodegradation and MBR fouling. The results demonstrate that the impact of the toxic flow on activated sludge depends on the recovery of the RO step but the same trends were observed regardless of the organic matter and salt contents of the concentrates: the concentration of proteins increased slightly. Size-exclusion high performance liquid chromatography (HPLC-SEC) was employed to study the effects of RO concentrate on the production of protein-like soluble microbial products (SMPs) and demonstrated a significant peak of protein-like substances corresponding to 10-100 kDa and 100-1 000 kDa molecules in the supernatant. Thus a significant increase in the propensity for sludge fouling was observed, which could be attributed to the increased quantity of protein-like substances. Finally, the effect of the concentrate on sludge activity was studied and no significant effect was observed on biodegradation, indicating that the return of the concentrate to the MBR could be a good alternative.
Keywords:
- Membrane bioreactor (MBR),
- concentrate,
- reverse osmosis,
- water reuse,
- MBR fouling
Résumé
Les effluents d’eaux usées peuvent être traités par un système membranaire intégré couplant un bioréacteur à membrane (BAM) et un procédé d’osmose inverse (OI) pour l’élimination de micropolluants dans le domaine de la production d’eaux de haute qualité en vue de les réutiliser. Cependant, le rejet des concentrats d’OI dans la nature pourrait causer de sérieux problèmes environnementaux en raison des composés toxiques qu’ils peuvent contenir (c.-à-d., micropolluants, sels, matières organiques). Afin de pallier ce problème, la recirculation des concentrats d’OI vers le BAM peut être envisagée. Il est cependant important d’étudier en profondeur une telle opération, puisque les composés contenus dans les concentrats (micropolluants, sels, matières organiques) peuvent avoir une influence directe ou indirecte sur le colmatage des membranes et l’activité biologique dans les BAM. Dans ce contexte, ce travail avait pour principal objet l’étude de cette recirculation en prenant en compte le phénomène de colmatage. À cet effet, des expériences ont été menées dans une filière couplant BAM et OI à l’échelle laboratoire et fonctionnant en mode continue. Le principal objectif était de déterminer le rendement de l’unité d’OI et du procédé global, ce qui indique le maintien de bonnes performances en termes de biodégradation et de colmatage. Les résultats montrent que l’impact des concentrats toxiques sur les boues dépend du rendement de l’étape d’OI. Les mêmes tendances ont été observées, quelle que soit la teneur des concentrats en matières organiques : une légère augmentation de la concentration en protéines est observée. La chromatographie liquide par perméation de gel à haute performance (HPLC-SEC) a été utilisée pour étudier les effets des concentrats d’OI sur la production de matières microbiennes solubles de types protéiques; en résulte une augmentation significative des pics correspondant aux substances protéiques de 10 à 100 kDa et de 100 à 1 000 kDa dans le surnageant. Par conséquent, une plus forte tendance au colmatage peut être observée et serait due à la présence élevée de protéines. Enfin, aucun effet sur l’activité biologique de la biomasse n’a été observé, ce qui indique que la recirculation des concentrats d’OI vers les BAM représente une bonne solution de rechange.
Mots-clés :
- Bioréacteur à membrane (BAM),
- concentrat,
- osmose inverse,
- réutilisation des eaux,
- colmatage du BAM
Corps de l’article
1. Introduction
The use of the membrane bioreactor process for wastewater and reuse is increasing. However, MBR permeate can still contain viruses and dissolved organic pollutants that have to be removed before reusing the water, and secondary effluents should therefore be treated by an integrated membrane system comprising microfiltration and reverse osmosis for effective removal of micropollutants. KIM et al. (2007) reported that treating wastewater with a microfiltration membrane using reverse osmosis is sufficient to effectively remove a variety of various micropollutants, such as pharmaceuticals and hormones. According to VANDECASTEELE and LEJON (2003), the concentrate to feed volume ratio is 1-10% for microfiltration and ultrafiltration, 15-30% for nanofiltration and 15-60% for reverse osmosis. The concentrate composition is largely determined by the pore size of the membrane. Concentrates from microfiltration and ultrafiltration contain suspended solids and colloidal particles, whereas nanofiltration and reverse osmosis concentrates contain high concentrations of ions and small organic compounds. If the reverse osmosis concentrate is discharged directly to the natural environment, serious environmental impacts may occur due to the toxic components contained in the concentrate (e.g. micropollutants, salts and organic matter). To address this issue, reverse osmosis concentrate can be continuously recirculated to an MBR. The recirculation of non-biodegradable organic matter could contribute, directly or indirectly, to membrane fouling. Nevertheless, recirculating multivalent cations such as calcium, magnesium and iron may facilitate bio-flocculation, which may reduce fouling of the MBR membranes by reducing the cake layer resistance through a decrease in the filamentous bacteria and better flocculation caused by cation bridges (KIM and JANG 2006; ARABI and NAKHLA 2009). Improved biodegradation was observed in an MBR-RO system with RO concentrate recirculation (TANSEL et al., 2005), a plausible explanation for which is that MBR-RO effluent does not contain significant amounts of suspended solids since the bacteria are attached to the membranes as biofilm. The overall solids removal by the aerated rotating membrane bioreactor system was about 85%- 90%.
The concentrate is composed of all the dissolved substances retained by the membrane (organic matter, micropollutants and salts). Micropollutants are small organic or mineral molecules, such as pesticides, pharmaceuticals or endocrine disrupting compounds that eventually find themselves in wastewater at concentrations in the range of ng∙L‑1 to μg∙L‑1. They can be environmentally harmful, and present serious risks to health. They are highly water soluble and are not properly removed by conventional treatment processes (SIMON et al., 2004).
Research on reverse osmosis concentrates has been extended recently and their main characteristics are summarized in Table 1. The concentration of multivalent cations such as calcium and magnesium is high and similar results have been found for anions such as Cl‑ and SO42‑, which may reduce the fouling potential in MBRs. However, if the concentrations of multivalent ions are too high, this may cause scaling of the membrane. Additionally, high concentrations of dissolved organic carbon may affect the MBR performance.
Table 1
Physico-chemical characteristics of reverse osmosis concentrate
Caractéristiques physicochimiques du concentrat d’osmose inverse

a Chemical oxygen demand
b Dissolved organic carbon
c [1] BAGASTYO et al. (2011); [2] RADJENOVIC et al. (2011a); [3] BAGASTYO et al. (2011); [4] YOON et al. (2004); [5] RADJENOVIC et al. (2011b); [6] SOLLEY et al. (2010)
JULIASTUTI et al. (2003) and KAPPEL et al. (2014) reported that the recirculation of nanofiltration (NF) concentrates did not have a negative impact on the nitrification performance. However, one possible negative effect could be the expected accumulation of heavy metals, which are known to inhibit nitrification even at low concentrations. Increased concentrations of copper in the MBR feed due to the recirculation of nanofiltration concentrate may be toxic to microorganisms. A copper concentration of 0.02 mg∙L-1, leading to 22% inhibition, has been observed (MADONI et al., 1999). Copper has a stronger inhibitory effect than zinc, with IC50- values of 0.08 mg∙L‑1 for Cu2+ and 0.35 mg∙L‑1 for Zn2+ (JULIASTUTI et al., 2003).
To minimize the discharge of the RO concentrate directly into natural water, the MBR can be combined with RO and the RO concentrate recirculated back to the MBR. The average MLSS (mixed liquor suspended solids) and MLVSS (mixed liquor volatile suspended solids) concentrations are higher when the RO concentrate is sent back to the MBR (LEW et al., 2005. KAPPEL et al. (2014) examined the impacts of NF concentrate recirculation on membrane performance in an integrated MBR and NF membrane process for wastewater treatment, and observed that dissolved and colloidal chemical oxygen demand (COD) were always higher in the MBR supernatant. The increased dissolved COD was probably directly related to the NF concentrate recirculation and the colloidal COD could be related to changes in the floc structure. These may have been the cause of a continuous increase in transmembrane pressure.
Total organic carbon concentration in the MBR permeate after the addition of concentrate was higher than before and, consequently, the concentration of organic compounds in the MBR permeates could also be higher. The main organics in the MBR effluent, such as proteins, polysaccharides, and humic-like substances, were completely retained by the NF membrane and were accumulated then biodegraded in the MBR. The microbial community of the MBR did not change significantly with the recycling of the NF concentrate (WANG et al., 2015). The influence of the toxic compound addition on the soluble microbial product (SMP) production has been reported by several researchers. After adding 2,4-dimethyl phenol (DMP) into an MBR, LESAGE (2005) observed a significant increase of extracellular polymeric substance concentration, especially of proteins, in the supernatant. The injection of the toxic compound caused a very strong concentration (900 to 1 000 mg∙L‑1) of the polymer in the supernatant. LI (2014) reported that, before the addition of CBZ (carbamazepine) to the MBR, the MBR membrane retained almost all the 100-1 000 kDa protein-like substances. In contrast, after CBZ addition, almost all the 10-100 kDa protein-like substances passed through the MBR membrane. Since a significant increase of the 10-100 kDa protein-like substances and a significant decrease of 100-1 000 kDa was observed in the MBR supernatant, after addition of CBZ to the MBR, the small biopolymer appears to play an important role in the sludge fouling propensity.
In the present work, long-term study concerning the effects of RO concentrate on MBR performance was carried out by adding RO concentrate directly into the MBR. In detail, (i) the biodegradation in the bioreactors, (ii) the MBR supernatant and permeate composition and (iii) the MBR fouling were investigated.
2. Material and Methods
2.1. MBR-RO set up
The lab-scale MBR contained one submerged, flat sheet, microfiltration membrane (Kubota, Japan) with a filtration area of 0.1 m2 and 0.2 µm pore size. The membrane was operated at 15 L∙m‑2∙h‑1 LMH. The reactor was aerated with big air bubbles at a flow rate of 1.5 L∙min‑1. Another aeration system with fine air bubbles was also used to maintain the dissolved oxygen concentration in the sludge at about 2-3 mg∙L‑1. The sludge recirculation was fixed at 4 L∙h‑1. Membrane relaxation steps of 4 min were performed every 8 min. The MBR was operated at a 30 d SRT (solid retention time), with a sludge concentration in the aerobic reactor of 8-9 g∙L‑1 and an organic loading rate of about 0.2 kg COD∙kg‑1 MLSS∙d‑1. The MBR feed was taken from a wastewater treatment plant close to Toulouse, France, after a primary physical treatment. The MBR permeate was collected over 3 weeks and used as inflow to the RO system. The concentrate from the RO system returned continuously to the MBR at a flow rate of 0.15 L∙h‑1. The concentration factor was 2.4. The RO concentrate made up 15% of the total inflow (wastewater + concentrate) and the wastewater 85%. The detailed characteristics of the wastewater and RO concentrate sampled at concentration factor CF = 2.4 are summarized in Table 2.
Table 2
Characteristics of wastewater and reverse osmosis (RO) concentrate
Caractéristiques des eaux usées et du concentrat

a Mixed liquor suspended solids
b Chemical oxygen demand
c Dissolved organic carbon
d No analysis
2.2. Analytical methods
The analytical methods used in this study are given in Table 3.
Table 3
Analytical methods used in this study
Méthodes d’analyses utilisées dans cette étude

a LI (2014)
b TEYCHENE et al. (2011)
3. Results and Discussion
3.1. Effect of RO concentrate on the biomass characteristics
To investigate the effect of RO concentrate on the biomass characteristics, the floc size distribution was analyzed on the activated sludge taken from the MBR before and after the addition of concentrate. Figure 1 shows that, after 1 d of RO concentrate addition, the floc size increased slightly, from 80 to 106 µm. However, it decreased to 68 µm after 3 d of adding concentrate and no change was observed after 7 and 14 d of adding concentrate. This means that the presence of concentrate in the MBR had a slight influence on the sludge floc size distribution. However no significant decay of sludge occurred, because MLSS concentration in the MBR was quite stable during the filtration time (about 7.8 ± 1 g∙L‑1).
Figure 1
Effect of reverse osmosis (RO) concentrate on sludge floc size distribution
Effet du concentrat d’osmose inverse sur la taille de floculation de boue

3.2. Effect of RO concentrate on COD and nitrogen total removal efficiencies in MBR
The influence of RO concentrate on COD removal efficiency is presented in Figure 2a. The measured COD concentration of 42 ± 5 mg∙L‑1 in the RO concentrate was much lower than that in the wastewater (799 ± 12 mg∙L‑1). The COD concentration in MBR effluent was around 18 mg∙L‑1, both before and after the addition of RO concentrate, and the COD removal rate was steady at above 97% throughout the entire experiment. This means that RO concentrate recirculation did not affect the biodegradable COD in the MBR. Similarly, KAPPEL et al. (2014) found that the recirculation of NF concentrates did not affect COD removal.
Figure 2
Effect of reverse osmosis (RO) concentrate on chemical oxygen demand (COD) and total nitrogen (TN) removal efficiency in MBR: a) COD, b) TN
Effet du concentrat d’osmose inverse sur l’efficacité d’élimination de la demande chimique en oxygène (DCO) et de l’azote total dans le bioréacteur à membrane : a) DCO, b) azote total

The efficiency of total nitrogen removal is also shown in Figure 2b. The concentration of total nitrogen in wastewater was around 35 mg∙L‑1 but, after filtration in the MBR, it decreased significantly to 9 mg∙L‑1 before the RO concentrate was added. The removal rate of total nitrogen was 74% and this efficiency was steady for 2 weeks after the addition of RO concentrate. The phenomena mentioned could explain why the recirculation of RO concentrate did not affect the inhibition of the nitrification process.
3.3. Effect of RO concentrate on dissolved organic carbon concentration
Figure 3a shows the results for dissolved organic carbon concentration in the MBR supernatant and permeate before and after the addition of RO concentrate. After 1 d of adding concentrate, no significant effect was found, with only an increase of 9% for dissolved organic carbon (DOC) concentration. The DOC concentration in the supernatant had increased by 24% after 14 d of concentrate addition. Therefore, after RO concentrate was added to the activated sludge, the organic compounds in the sludge may have changed. However, DOC concentration in the MBR permeate was around 4.5-5.9 mg∙L‑1 and the removal efficiency in the MBR process was high, about 96%.
Figure 3
Effect of reverse osmosis (RO) concentrate on a) dissolved organic carbon (DOC) and b) protein and polysaccharide concentrations in membrane bioreactor (MBR) supernatant and permeate
Effet du concentrat d’osmose inverse sur : a) le carbone organique dissous, b) les concentrations en protéines et en polysaccharides dans le surnagent et le perméat du bioréacteur à membrane

3.4. Effect of RO concentrate on supernatant composition
The effects of RO concentrate on supernatant concentration were measured on supernatant and permeate sampled from the MBR before and after the addition of concentrate. Figure 3b shows that a significant increase (about 32%) in the protein concentration in the supernatant was found after 1d of adding of RO concentrate. After 3 d, the concentration had dropped again and remained almost constant for the next 7 d. After two weeks of concentrate addition, the protein concentration in the supernatant of the MBR had increased to a value similar to its value after 1 d of RO concentrate addition.
To understand the effect of RO concentrate more clearly, MBR supernatants before and after the addition of RO concentrate were analyzed by HPLC-SEC. Figure 4a shows a significant peak in protein-like substances corresponding to 10-100 kDa molecules in the supernatant from the MBR (about 25%) after only 1 d of adding RO concentrate, whereas, no change was found for 100-1 000 kDa protein-like SMPs. A reduced effect of RO concentrate on the production of 10-100 kDa protein-like SMPs in the supernatant was observed between 3 and 7 d after the addition of concentrate (Figure 4b).
Figure 4
Size-exclusion high performance liquid chromatography (HPLC-SEC) analysis: a) membrane bioreactor (MBR) supernatant before and 1 d after addition of concentrate, b) MBR supernatant at 3 and 7 d after addition of concentrate, c) MBR supernatant before and 14 d after addition of concentrate
Analyse HPLC-SEC : a) le surnageant du bioréacteur à membrane (BAM) avant et 1 jour après l’ajout du concentrat, b) le surnageant du BAM à 3 et 7 jours après l’addition du concentrat, c) le surnageant du BAM avant et 14 jours après l’addition du concentrat

Relating to the increase of protein and polysaccharide concentrations after 14 d of addition of RO concentrate, quite a significant peak (about 25% increase) of protein-like substances with a molecular size of 10-100 kDa was observed (Figure 4c), similarly to the results of Figure 4a. More specifically, for the peak heights of 100-1 000 kDa protein-like SMPs, a more significant increase, of about 50%, was found in the supernatant of the MBR. Possible explanations could be that the bacteria in the activated sludge may have adapted easily to the stress of toxic components (contained in the RO concentrate) or that the decay of some bacteria released some protein-like SMPs.
3.5. Effect of RO concentrate on sludge and supernatant filterability
In order to investigate the fouling potential of the sludge and supernatant fractions of these sludges, filterability tests were performed with samples taken from the MBR. Figure 5a shows that after 1 d of addition of RO concentrate, the fouling resistance decreased. This result could concern an increase of particle size in the MBR sludge (Figure 1), leading to an increased filterability of the activated sludge. However, the fouling resistance increased quite significantly after 14 d of addition of RO concentrate. This result may show that the presence of RO concentrate in the activated sludge could lead to a modification of the biomass physico-chemical characteristics or a change in microbial activity. The results of Figure 4a and 4c also point out the important role of large molecules and small molecules in the fouling propensity of sludge.
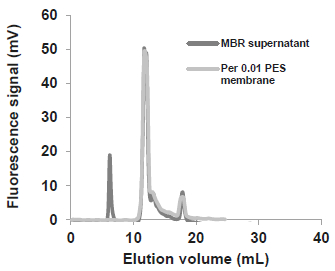
Like the results from the sludge filterability test, the fouling propensity of the supernatant increased after 14 d of addition of RO concentrate in the MBR (Figure 5b). The results seems to be related to a change of both macro molecular and small molecular proteins in the supernatant after the addition of concentrate (Figure 4a and 4c). To better understand the rise in supernatant fouling propensity, HPLC-SEC analysis of the supernatant and the corresponding permeate was performed on a 0.01 µm PES (polyethersulfone) membrane. The results of Figure 6 demonstrate that the small protein molecules could pass through the 0.01 µm PES membrane. Therefore, the fouling may be mainly related to the almost complete rejection of the large protein molecules in the supernatant by the 0.01 µm PES membrane.
Figure 5
Effect of reverse osmosis (RO) concentrate on filterability tests on: a) the sludge, b) the supernatant. Rf: fouling resistance
Effet du concentrat d’osmose inverse sur les tests de filtration : a) de la boue, b) du surnageant. Rf : résistance de colmatage

Figure 6
Size-exclusion high performance liquid chromatography (HPLC-SEC) analysis of membrane bioreactor (MBR) supernatant and permeate observed in the supernatant filterability test 14 d after addition of concentrate
Analyse HPLC-SEC du perméat du bioréacteur à membrane et du perméat du test de filtration du surnageant 14 jours après l’addition du concentrat
3.6. Effect of RO concentrate on MBR fouling
The variation of transmembrane pressure (TMP) in the MBR was one of the factors that could affect MBR fouling. The change of TMP during operation of the MBR before and after RO concentrate addition in the MBR can be seen in Figure 7. The MBR flux was stable at 15 L∙m‑2∙h‑1 while TMP changed slightly during the filtration time with no concentrate added directly into the aerobic reactor. To clarify our understanding of the change of TMP before the concentrate was added, HPLC-SEC analysis of MBR supernatant and permeate was examined (Figure 8a). The results indicated that the MBR membrane could reject almost all the large protein molecules. They could form a gel layer on the membrane surface. In contrast, all the small protein molecules passed through the MBR membrane. So, the slight increase of TMP before the addition of the concentrate could be ascribed to the rejection of 100-1 000 kDa protein-like SMPs by the MBR membrane.
Figure 7
Effect of reverse osmosis concentrate on transmembrane pressure (TMP) of membrane bioreactor
Effet du concentrat d’osmose inverse sur la pression transmembranaire du bioréacteur à membrane

Figure 8
Size-exclusion high performance liquid chromatography (HPLC-SEC) analysis: a) supernatant and permeate of membrane bioreactor (MBR) before addition of concentrate, b) supernatant and permeate of MBR 14 d after addition of concentrate
Analyse HPLC-SEC : a) le surnageant et le perméat du bioréacteur à membrane (BAM) avant l’addition du concentrat, b) le surnageant et le perméat du BAM 14 jours après l’addition du concentrat

After 1 d of adding the RO concentrate, no change of TMP was observed in the MBR. However, after 3 d of RO concentrate addition, a slight rise of TMP occurred and increased continuously in the following days. A significant rise of TMP in the MBR appeared after 14 d of addition of RO concentrate, indicating that the occurrence of MBR fouling could be related to a change in biomass characteristics or a change in the supernatant composition. The change in the composition of supernatant occurred and has been discussed in the previous section. Furthermore, HPLC-SEC analysis of MBR supernatant and permeate was performed after 14 d of addition of concentrate. The results showed that the MBR membrane retained almost all the 100-1 000 kDa protein-like substances, indicating that a fouling layer could be formed on the membrane surface. In contrast, almost all the 10-100 kDa protein-like substances passed through the MBR membrane and could have modified the fouling inside the membrane pores caused by adsorption of small molecules, or pore blocking due to colloids (Figure 8b).
4. Conclusion
The experimental results revealed no significant effect on the removal efficiencies of COD, total nitrogen and DOC when RO concentrates were recirculated to the MBR. The protein concentration in the MBR supernatant increased by 32% after both 1 and 14 d of RO concentrate addition. The results of HPLC-SEC analysis showed that, after only 14 d of RO concentrate addition, a significant increase was found in 100-1 000 kDa protein concentration. Concerning the peak-height of 10-100 kDa protein-like SMPs, the increase in the concentration of small molecules occurred after 1 and 14 d of RO concentrate addition. Hence a significant increase of sludge fouling propensity was observed after 14 d, addition of RO concentrate, which could be attributed to an increase in the quantity of protein-like substances. In addition, the change in the supernatant composition could lead to a significant increase of TMP in the MBR after 14 d, addition of concentrate. The presence of RO concentrate in the MBR did not have any significant influence on the biodegradation, indicating that the return of the concentrate to the MBR could be a good alternative to its release into the environment. Finally, more studies should also be carried out with the objective of examining the elimination of micropollutants during the combined operation of the various units.
Parties annexes
References
- ARABI S. and G. NAKHLA (2009). Impact of cation concentrations on fouling in membrane bioreactors. J. Membrane Sci., 343 (1-2), 110-118.
- BAGASTVO A.Y., J. KELLER, Y. POUSSADE and D.J. BATSTONE (2011). Characterisation and removal of recalcitrants in reverse osmosis concentrates from water reclamation plants. Water Res., 45 (7), 2415-2427.
- BAGASTYO A.Y., J. RADJENOVIC, Y. MU, R.A. ROZENDAL, D.J. BATSTONE and K. RABAEY (2011). Electrochemical oxidation of reverse osmosis concentrate on mixed metal oxide (MMO) titanium coated electrodes. Water Res., 45 (16), 4951-4959.
- LEW C.H., J.Y. HU., L.F. SONG., L.Y. LEE., S.L. ONG., W.J. NG and H. SEAH (2005). Development of an integrated membrane process for water reclamation. Water Sci. Technol., 51 (6-7), 455-463.
- JULIASTUTI S.R., J. BAEYENS, C. CREEMERS, D. BIXIO and E. LODEWYCKX (2003). The inhibitory effects of heavy metals and organic compounds on the net maximum specific growth rate of the autotrophic biomass in activated sludge. J. Hazard. Mater., 100 (1-3), 271-283.
- KAPPEL C., A.J.B. KEMPERMAN, H. TEMMINK, A. ZWIJNENBURG, H.H.M. RIJNAARTS and K. NIJMEIJER (2014). Impacts of NF concentrate recirculation on membrane performance in an integrated MBR and NF membrane process for wastewater treatment. J. Membrane Sci., 453, 359-368.
- KIM I.S. and N. JANG (2006). The effect of calcium on the membrane biofouling in the membrane bioreactor (MBR). Water Res., 40 (14), 2756-2764.
- KIM S.D., J. CHO, I.S. KIM, B.J. VANDERFORD and S.A. SNYDER (2007). Occurrence and removal of pharmaceuticals and endocrine disruptors in South Korean surface, drinking, and waste waters. Water Res., 41 (5), 1013-1021.
- LESAGE N.I. (2005). Étude d’un procédé hybride Adsorption/Bioréacteur à membranes pour le traitement des effluents industriels. PhD dissertation, INSA de Toulouse, France, 294 p.
- LI C. (2014). Étude de l’impact de micropolluants pharmaceutiques sur le colmatage des BAM utilisés en traitement des eaux usées urbaines : cas de la carbamazépine. PhD dissertation, INSA de Toulouse, France, 207 p.
- MADONI P., D. DAVOLI and L. GUGLIELMI (1999). Response of sOUR and AUR to heavy metal contamination in activated sludge. Water Res., 33 (10), 2459-2464.
- RADJENOVIC J., A. BAGASTYO, R.A. ROZENDAL, Y. MU, J. KELLER and K. RABAEY (2011a). Electrochemical oxidation of trace organic contaminants in reverse osmosis concentrate using RuO2/IrO2-coated titanium anodes. Water Res., 45 (4), 1579-1586.
- RADJENOVIC J., B.I. ESCHER and K. RABAEY (2011b). Electrochemical degradation of the β-blocker metoprolol by Ti/Ru0.7Ir0.3O2 and Ti/SnO2-Sb electrodes. Water Res., 45 (10), 3205-3214.
- SIMON A.P., J. BRUCE, H.G. EMMA, R.J. PETER and A.F. DAVID (2004). Natural organic matter - the relationship between character and treatability. Water Sci. Technol., 4 (5-6), 43-48.
- SOLLEY D., C. GRONOW, S. TAIT, J. BATES and A. BUCHANAN (2010). Managing the reverse osmosis concentrate from the Western Corridor Recycled Water Scheme. Water Practice Technol., 5, 1-8.
- TANSEL B., J. SAGER, T. RECTOR, J. GARLAND, R.F. STRAYER, L. LEVINE and J. BAUER (2005). Integrated evaluation of a sequential membrane filtration system for recovery of bioreactor effluent during long space missions. J. Membrane Sci., 255 (1-2), 117-124.
- VANDECASTEELE C. and L. LEJON (2003). Reuse, treatment, and discharge of the concentrate of pressure-driven membrane processes. Environ. Sci. Technol., 37 (17), 3733-3738.
- WANG J., K. LI, Y. WEI, Y. CHENG, D. WEI and M. LI (2015). Performance and fate of organics in a pilot MBR–NF for treating antibiotic production wastewater with recycling NF concentrate. Chemosphere, 121, 92-100.
- YOON Y., Y. OK, D. KIM and J. KIM (2004). Agricultural recycling of the by-product concentrate of livestock wastewater treatment plant processed with VSEP RO and bio-ceramic SBR. Water Sci. Technol., 49 (5-6), 405-12.
Liste des figures
Figure 1
Effect of reverse osmosis (RO) concentrate on sludge floc size distribution
Effet du concentrat d’osmose inverse sur la taille de floculation de boue
Figure 2
Effect of reverse osmosis (RO) concentrate on chemical oxygen demand (COD) and total nitrogen (TN) removal efficiency in MBR: a) COD, b) TN
Effet du concentrat d’osmose inverse sur l’efficacité d’élimination de la demande chimique en oxygène (DCO) et de l’azote total dans le bioréacteur à membrane : a) DCO, b) azote total
Figure 3
Effect of reverse osmosis (RO) concentrate on a) dissolved organic carbon (DOC) and b) protein and polysaccharide concentrations in membrane bioreactor (MBR) supernatant and permeate
Effet du concentrat d’osmose inverse sur : a) le carbone organique dissous, b) les concentrations en protéines et en polysaccharides dans le surnagent et le perméat du bioréacteur à membrane
Figure 4
Size-exclusion high performance liquid chromatography (HPLC-SEC) analysis: a) membrane bioreactor (MBR) supernatant before and 1 d after addition of concentrate, b) MBR supernatant at 3 and 7 d after addition of concentrate, c) MBR supernatant before and 14 d after addition of concentrate
Analyse HPLC-SEC : a) le surnageant du bioréacteur à membrane (BAM) avant et 1 jour après l’ajout du concentrat, b) le surnageant du BAM à 3 et 7 jours après l’addition du concentrat, c) le surnageant du BAM avant et 14 jours après l’addition du concentrat
Figure 5
Effect of reverse osmosis (RO) concentrate on filterability tests on: a) the sludge, b) the supernatant. Rf: fouling resistance
Effet du concentrat d’osmose inverse sur les tests de filtration : a) de la boue, b) du surnageant. Rf : résistance de colmatage
Figure 6
Size-exclusion high performance liquid chromatography (HPLC-SEC) analysis of membrane bioreactor (MBR) supernatant and permeate observed in the supernatant filterability test 14 d after addition of concentrate
Analyse HPLC-SEC du perméat du bioréacteur à membrane et du perméat du test de filtration du surnageant 14 jours après l’addition du concentrat
Figure 7
Effect of reverse osmosis concentrate on transmembrane pressure (TMP) of membrane bioreactor
Effet du concentrat d’osmose inverse sur la pression transmembranaire du bioréacteur à membrane
Figure 8
Size-exclusion high performance liquid chromatography (HPLC-SEC) analysis: a) supernatant and permeate of membrane bioreactor (MBR) before addition of concentrate, b) supernatant and permeate of MBR 14 d after addition of concentrate
Analyse HPLC-SEC : a) le surnageant et le perméat du bioréacteur à membrane (BAM) avant l’addition du concentrat, b) le surnageant et le perméat du BAM 14 jours après l’addition du concentrat
Liste des tableaux
Table 1
Physico-chemical characteristics of reverse osmosis concentrate
Caractéristiques physicochimiques du concentrat d’osmose inverse
a Chemical oxygen demand
b Dissolved organic carbon
c [1] BAGASTYO et al. (2011); [2] RADJENOVIC et al. (2011a); [3] BAGASTYO et al. (2011); [4] YOON et al. (2004); [5] RADJENOVIC et al. (2011b); [6] SOLLEY et al. (2010)
Table 2
Characteristics of wastewater and reverse osmosis (RO) concentrate
Caractéristiques des eaux usées et du concentrat
a Mixed liquor suspended solids
b Chemical oxygen demand
c Dissolved organic carbon
d No analysis
Table 3
Analytical methods used in this study
Méthodes d’analyses utilisées dans cette étude
a LI (2014)
b TEYCHENE et al. (2011)