
Résumés
Abstract
This study examines whether references to Corporate Social Responsibility (CSR) in the editorials of sustainable development reports have any predictive influence with respect to firms’ inclusion in the Dow Jones Sustainability World Index (DJSWI). Signalling theory proposes hypotheses that can be tested by textual analysis of sustainable development report editorials published by French firms. The results suggest that these editorials may serve as leading indicators of CSR. The predictive power of editorials is strengthened when they are signed by the Chief Executive Officer (CEO), published in a sustainability report and written in a clear and readable style.
Keywords:
- sustainable development report,
- editorial,
- CSR performance,
- early warning signals,
- textual analysis,
- signalling theory
Résumé
Les références à la responsabilité sociale des entreprises (RSE) dans les éditoriaux des rapports de développement durable permettent-elles d’anticiper l’inclusion des entreprises dans le Dow Jones Sustainability World Index (DJSWI) ? En nous appuyant sur la théorie du signal et sur une analyse textuelle des éditoriaux des rapports de développement durable publiés par les entreprises françaises, nous montrons que les éditoriaux peuvent servir d’indicateurs avancés de la performance RSE. Le pouvoir prédictif des éditoriaux est renforcé lorsqu’ils sont signés par le directeur général, publiés dans un rapport de développement durable et rédigés dans un style clair et lisible.
Mots-clés :
- rapport de développement durable,
- éditorial,
- performance RSE,
- signaux d’alerte précoce,
- analyse textuelle,
- théorie du signal
Resumen
¿Las referencias a la Responsabilidad Social Corporativa (RSC) en las memorias de desarrollo sostenible anticipan la inclusión de las empresas en el Índice Mundial de Sostenibilidad Dow Jones (DJSWI en inglés)? Basándonos en la Teoría de la Señal y en un análisis textual de las memorias de desarrollo sostenible publicadas por las empresas francesas, demostramos que las memorias pueden servir como indicadores principales de los resultados de RSC. El poder predictivo de las memorias aumenta cuando están firmados por el director general, se publican en un informe sobre sostenibilidad y están redactadas en un estilo claro y comprensible.
Palabras clave:
- memoria de desarrollo sostenible,
- informe,
- resultado de RSC,
- señales de alerta temprana,
- análisis preciso,
- teoría de la señal
Corps de l’article
Faced with the increasingly visible consequences of the global ecological crisis, companies are confronted with ever more pressing expectations in terms of sustainable development. The pressures come from consumers but also from investors who are increasingly integrating sustainable development objectives (e.g., decarbonization of the economy, etc.) into their agendas. Managers must therefore put in place strategies and actions in terms of CSR (Corporate Social Responsibility), but also make their efforts known to various stakeholders.
From a stakeholder perspective, and in particular the perspective of socially responsible investors (SRIs), it is important to know how to quickly identify successful companies in terms of CSR. Indices of corporate ethics and sustainable development—such as the Calvert Responsible Indexes, Ethibel Sustainability Index, MSCI KLD 400 Social Index, FTSE4Good Index, or Dow Jones Sustainability Index—allow stakeholders to easily spot the most virtuous firms—in the case of positive selection we speak of sustainability indices—and/or exclude the less ethical ones—in the case of negative selection, for example, the exclusion of firms involved in arms dealing or gambling (Fowler and Hope, 2007). To be included in these indices, the virtuous companies must have proven themselves for a certain time period. It is therefore not easy for investors to know ex ante which company will (or will not) be included in this type of index.
Stakeholders can also judge a company’s CSR efforts by consulting its sustainability report. Listed companies resort increasingly to the publication of an annual sustainable development report (KPMG, 2017)—also termed CSR report—or an integrated report (Melloni et al., 2017). This is a complimentary signal firms may send in order to inform stakeholders of their past (year covered by the report) and future (plans for the coming years) achievements in terms of CSR. Those reports may then serve as a leading indicator of a firm’s inclusion in or exclusion from a sustainability index. This research thus seeks to answer the following question: Do sustainable development reports improve the prediction of a firm’s inclusion (or non-inclusion) in a sustainability index? To the best of our knowledge, this is the first attempt to predict inclusion in a sustainability index based on sustainable development report editorials.
To answer this question, hypotheses are proposed based on the CSR approach by Carroll (1979) and on signalling theory (Connelly et al., 2011). They shall be tested by considering the editorials in the annual reports of a sample of large French firms for the period 2003–2017. These data shall be compared with the inclusion of those same firms in the Dow Jones Sustainable World Index (DJSWI) year by year through a panel data logistic regression (logit model). The DJSWI has been selected as the sustainability index because it is one of the most prominent indicators of CSR performance worldwide (Oberndorfer et al., 2013).
This paper makes several contributions. This is the first article to study the prediction of a firm’s inclusion in a sustainability index based on sustainable development report editorials. This research question is of particular interest for SRIs (Ziegler and Schröder, 2010). Second, we mobilize early warning signals methodology used in practice by international organizations such as the IMF or World Bank to predict financial crises (Demirguc-Kunt and Detragiache, 2000). The objective is to determine whether certain economic indicators can serve as leading indicators of financial crises (e.g., currency crises, banking crises, sovereign debt crises, equity market crises). This paper uses a similar early warning system model, based on sustainable development reports, for predicting firms’ inclusion in the DJSWI. As far as we are aware, such a method has not been used before for CSR. Third, the paper takes an original approach based on textual analysis to extract a measure of the intensity of reference to CSR in editorials of firms’ annual reports. Lastly, the article proposes a direct test of signalling theory.
The remainder of the paper is arranged as follows. Section 2 sets out the theoretical context of the research and shows the relevance of signalling theory for studying the relationship between sustainable development report editorials and the firms’ inclusion in a sustainability index; several hypotheses are proposed on this basis. Section 3 details the data and the construction of variables used in the empirical study. Section 4 presents methods for the empirical study and sets out the results. Section 5 concludes with a summary of the findings, the limitations of the research, and avenues for future enquiry.
Review of the literature and hypotheses
Dow Jones Sustainability World Index and CSR performance
The performance of policies and actions implemented by firms in the area of CSR make up corporate social performance (CSP). CSP gives rise to various operationalizations in the literature. For some commentators, the firm’s CSP can be evaluated by analysing the information the firm communicates about its efforts in the area of CSR (e.g., Khan et al., 2013), the underlying idea being that the more a firm communicates on the issue, the more effort it puts into it. Conversely, if the firm makes little effort or is open to criticism in terms of CSR, it will avoid addressing the subject at any length in its communication. Other research bases CSP on evaluations by outside firms such as KLD (e.g., Johnson and Greening, 1999). For others, the firm’s presence in ethical funds or highly sustainable performance funds (such as the Dow Jones Sustainability World Index) is an indicator of enhanced CSP (e.g., Artiach et al., 2010). Our empirical study is in keeping with this latter approach.
The DJSWI is one of the most prominent indicators of CSR performance and has been the subject of much academic research (e.g. Oberndorfer et al., 2013; López et al., 2007). The firms that make up the DJSWI have higher CSP levels than their peers. The DJSWI is considered one of the world’s best CSR indices particularly because of the quality of its evaluation process based on best practices (Beloe et al., 2004). It also enjoys very great credibility among professionals (Sadowski et al., 2010, p. 15).
Published studies integrating the DJSWI consider that firms’ inclusion in this index may positively or negatively influence financial performance (López et al., 2007; Oberndorfer et al., 2013). Ziegler and Schröder (2010) and Artiach et al. (2010) study the determinants of inclusion in the DJSWI. So far as we are aware, no other research has considered inclusion in the DJSWI as a variable to be predicted by mobilizing early warning signals methodology in the area of CSR.
Dimensions of CSR according to Carroll and CSP
We begin, therefore, by specifying the notion of CSR and then we present how this notion and CSP hinge together. Carroll (1979) defines CSR as all “the economic, legal, ethical, and discretionary (philanthropic) expectations that society has of organizations at a given point in time”. This multi-dimensional approach to CSR is widely accepted among the scientific community and has been used in very many theoretical and empirical studies (Vishwanathan et al., 2019; Aupperle et al., 1985). Quoting Wood and Jones (1996: 45), Carroll’s four domains have “enjoyed wide popularity among SIM (Social Issues in Management) scholars.” This suggests that Carroll’s CSR domains and pyramid framework remain a leading paradigm of CSR in the social issues in the field of management research.
The starting point for achieving a real CSR performance from Carroll’s (1979, 1991) perspective lies in the assimilation and adoption of the four dimensions of CSR. Accordingly, for a firm to achieve a high level of CSR performance, it must work on each of the four dimensions while being mindful of the relative level of importance of each of them. Carroll therefore assigns different weightings to each dimension: 4 for the economic dimension, 3 for the legal dimension, 2 for the ethical dimension, and 1 for the discretionary dimension.[1]
By examining a firm’s efforts in each of these four areas, it should be possible to predict its future CSR performance level. But where is this information to be found? Companies readily communicate on this subject in their sustainable development reports (or integrated reports).
Sustainable development report editorials
A large majority of major companies publish annual sustainable development reports. A study by KPMG (2017, p. 9) reports between 72 and 75 of the biggest 100 firms in each of the 49 countries in the study publish a sustainable development report. This figure rises to 93% for the world’s 250 largest corporations. Although these reports respond to a strong expectation from stakeholders, some consider that they are little read (Utopies, 2012) and too lengthy (Global Reporting Initiative, 2015). This is why we have concentrated on editorials and not on the full reports. These comparatively short texts, located at the beginning of the annual sustainable development reports (or integrated reports), generally evoke past and future CSR achievements as well as the company’s philosophy, commitment, and strategy in the domain. As in the editorials of annual reports, the authors of sustainable development reports enjoy complete freedom: the presentation and content of these texts are not subject to any regulatory constraints and are not subject to any formalized auditing (Muslu et al., 2019).
The editorials are the part of annual reports that are most likely to be read exhaustively (Fanelli and Grasselli, 2006, p. 816). The editorials are written by the Chief Executive Officer (CEO hereafter) or a top manager and are the leading means for them to communicate on their attitudes and values (Amernic et al., 2010). They are important components of CEOs’ narrative discourse because they are periodical (yearly), widely read, and written and signed by the CEO (Amernic and Craig, 2006); they are public statements of corporate goals, actions, and results (Courtis, 2004). It will be noted, lastly, that, in accordance with an incremental information approach (cf. infra), the informational value of CEO letters for predicting future financial performance (ROA [Return on Assets] or ROE [Return On Equity]) is generally acknowledged (Patelli and Pedrini, 2014).
The editorials of annual reports, like those of sustainable development reports, are of growing interest to management academics. Mäkelä and Laine (2011) study the editorials of the annual reports and sustainable development reports of two large Finnish firms in the metallurgy sector over a 10-year period to show how the texts are used by CEOs (and the companies more generally) to convey a certain world view (i.e., a certain ideology) and in particular a certain vision of sustainable development. Patelli and Pedrini (2014) study 664 editorials from annual reports by CEOs to evaluate the optimism of the statements using lexicometry. Boudt and Thewissen (2019) review 342 annual report editorials by CEOs over the period 2000–2011 to evaluate the optimism of the statements. Lastly, Muslu et al. (2019) show that the quality of disclosure of information in sustainable development reports of firms rated by KLD influences financial analysts. In particular, their findings highlight that when sustainable development reports are of high quality, financial analysts come up with more precise and better quality forecasts.
The editorial of the sustainable development report may be viewed as a means of communicating and informing about corporate strategy and past and future achievements in terms of CSR in a situation of information asymmetry between the sender (the firm) and the receiver (the stakeholder reading the editorial). Under certain conditions, this disclosure can be analysed as an efficacious signal for SRIs, among others. Indeed, according to signalling theory (Connelly et al., 2011), in a situation of information asymmetry, when an economic actor wants to convince a potential partner that it has an unobservable superior quality (compared to its competitors)—here a superior CSR performance—it must send out a costly signal. To be processed by the receiver, the signal must also be observable. To sum up, the signal will be effective if it is costly and observable, but the first quality is so central to signalling theory that some refer to it as the “theory of costly signalling” (e.g., Bird and Smith, 2005).
Two strands of research offer different views on disclosure (Brammer and Pavelin, 2006). On the one hand, the incremental information approach (e.g. Clarkson et al., 2008) proposes that the disclosure is sincere and aimed at overcoming information asymmetries. On the other hand, the impression management approach argues that managers tend to exhibit opportunistic behaviour and try to exploit information asymmetries by disclosing biased information (e.g., Melloni et al., 2017). In line with the first approach, we argue that editorials are costly signals that mitigate information asymmetries between firms and their stakeholders.
In France, the editorials of sustainable development reports are not under any legal constraint. There is significant flexibility in the way companies can report non-financial information. At the same time, editorials are included in mandatorily disclosed documents. Accordingly, they can be viewed either as incremental information or as an impression management strategy. In the following sub-section, we detail the reasons why editorials can be interpreted as a costly and observable signal for stakeholders. Hence, this paper takes the first view and argues that editorials provide incremental information.
Editorials as costly signals
CSR performance is an unobservable quality of the firm at time t for external stakeholders such as consumers and SRIs, creating a situation of information asymmetry. However, it may be revealed ex post by specific assessments (e.g., MSCI KLD, ASSET4 or other ESG ratings) or by the firm being included in a sustainability index such as the DJSWI. In order to benefit from certain advantages associated with CSR performance—such as easier access to SRIs—it is in the interest of the companies concerned to communicate as early as possible about their CSR efforts and achievements. Firms do this by emitting a signal through their sustainable development report and in particular its editorial, which is the most read part of the report (Fanelli and Grasselli, 2006, p. 816).
Because they set out the firm’s CSR strategy and past and future achievements, sustainable development reports—as an efficacious signal—convey information through which to anticipate the firm’s inclusion in (or exclusion from) sustainability indices. For example, if a firm presents a clear CSR strategy in its sustainable development report, with actual achievements to support it, it might be thought that the firm might make it into a sustainability index in the future. Conversely, a company whose sustainable development report fails to highlight any real and significant achievements in terms of CSR would have little chance of making the ratings or might drop out of them if previously rated. These editorials can therefore be thought of as leading indicators of firms’ CSR performance.
This can be justified by two complementary reasons. First, in signalling theory, for a signal to be deemed efficacious and included in the receiver’s decision-making process, it must first be costly for the emitter (Connelly et al., 2011). The editorial of a sustainable development report can be analysed as a costly signal because, in the event of decoupling—that is, if the editorial content proves to be inconsistent with future reality—the firm and/or the signatory of the editorial are exposed to penalty costs, that is, to future negative consequences that represent deferred costs. In this way, even if the receivers of the editorial (for example, SRIs) cannot ascertain the reliability of the editorial’s content at the time of publication, they will easily be able to do so ex post by observing the company’s position and its inclusion in a sustainability index.
If the editorial content turns out to be misleading—a case of decoupling—then the firm is exposed to three forms of penalty cost. The first of these concerns the negative impact on its corporate reputation. The behaviour of major companies is increasingly monitored by NGOs (Non-Governmental Organizations) and governments. For example, Marquis et al. (2016) show that the larger the company, the more they resort to foreign financing and the more they have activities that potentially generate problems for the environment, etc., then the more these companies are “scrutinized” by NGOs, governments, and so on. If they set out ambitious commitments and projects in terms of CSR in their sustainable development report but no actual achievements come from them, NGOs, trade unions, journalists, etc. will be quick to inform the general public. Moreover, lasting inconsistency between editorial content and the firm’s real commitment to CSR would damage stakeholder trust in the company’s word, which is the second type of penalty cost. Lastly, any decoupling would adversely affect the reputation of the author of the editorial (CEO or top manager), which would be the third penalty cost and might reduce their worth in the world market for senior managers. It can therefore be considered that the content of editorials of sustainable development reports is a costly signal, prompting firms and their managers to disclose reliable information.
Second, as already mentioned, there is a longstanding literature studying voluntary disclosure by firms, in particular with respect to the environment. A part of the literature—the so-called impression management literature—puts forward an obfuscation hypothesis and defends the idea that managers adopt opportunistic behaviour and try to manipulate their stakeholders (Merkl-Davies and Brennan, 2007; Melloni et al., 2017). Another strand of the literature, based on agency theory, adopts a different point of view and posits that managers disclose value-relevant information and act truthfully (Al Tuwaijri et al., 2004; Arena et al., 2015). Melloni et al. (2017) emphasize that impression management mostly occurs in less or non-regulated narrative disclosures. They point out that such a narrative disclosure, if mandatory—which is the case in France for sustainable development or integrated reports—should help to improve the quality of the disclosure. As suggested by Hąbek and Wolniak (2016) when studying a European sample, French firms almost exclusively communicate through mandatory reports whereas firms in other European countries (UK, Sweden, Poland) rely either on voluntary or mandatory disclosures. Moreover, they show that the quality of CSR reports in France is among the highest in their sample.
Our argumentation builds on this supposed and observed higher quality of mandatory disclosure in France. Due to its mandatory context, the editorial in a sustainability report should convey incremental information and help stakeholders in their decision-making, overcoming information asymmetry, at least partially. The information conveyed by the editorials, as a costly signal, might therefore be used as a leading indicator of the firm’s CSR performance:
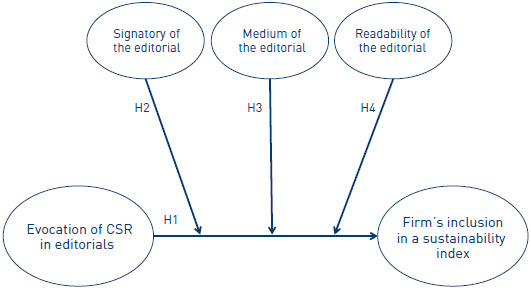
H1: The more CSR is evoked in editorials, the more likely the firm is to be included in a sustainability index.
Level of observability of the signal
According to signalling theory, cost is a necessary but not a sufficient characteristic of a signal; observability represents another characteristic of efficacious signals (Connelly et al., 2011). Observability is a characteristic of the signal that makes it more readily accessible to its addressees and that grabs their attention more. When a company emits a signal endeavouring to make it as observable as can be, it exposes itself by the same token to verification by different stakeholders such as the government or NGOs. It only has any interest in doing so therefore if its message is reliable.
Editorials are de facto observable signals since they are the most read parts of sustainable development reports (Mäkelä and Laine, 2011). However, the intensity of their observability may vary. Indeed, the literature conceptualizes observability in two ways: 1) as a binary attribute (observable/unobservable): a signal has to be observable to be efficacious (e.g., Janney and Folta, 2006); 2) as a continuum from weak to strong: the stronger the observability, the more efficacious the signal will be (e.g. Certo et al., 2001). According to this second approach, the level of observability of the signal is a moderator of the effectiveness of the signal.
This level of observability has different names depending on the authors: intensity, strength, clarity or visibility of the signal (Connelly et al., 2011), but it is always the same concept. We propose to operationalize it through three indicators: the signatory, the medium, and the readability of the editorial. These levers are moderators of the relationship posited by hypothesis H1. This means that they can strengthen or weaken the impact of evoking CSR within Carroll’s meaning in the editorials of annual reports on the firm’s inclusion in sustainability indices. Of course, other indicators could have been retained, such as, for example, the notoriety of the signatory. However, we limited ourselves to easily accessible data. The operationalization of the observability of the signal through three different indicators is a methodological contribution of this research since observability of editorials has never been studied as far as we know.
The signatory of the editorial
Editorials are typically signed by the CEO or by a top manager in charge of CSR or sustainable development. Given their notoriety, their power and their responsibilities, CEOs lend more force to the editorial content. Several studies (Amernic et al., 2010; Amernic and Craig, 2006) highlight the importance of editorials written by the CEO. In addition, Patelli and Pedrini (2014) recognize the informational value of CEO letters in predicting future financial performance (ROA or ROE). It may therefore be thought that the editorial will attract readers’ attention more and its content will be deemed more visible when signed by the CEO rather than by someone else. Hence:
H2: The positive impact of evoking CSR in the editorial on the firm’s inclusion in a sustainability index is strengthened when the editorial is signed by the CEO.
The medium of the editorial
Companies report on their CSR policy either in the annual sustainable development (or integrated) report or, failing that, in a specific section of their annual report. The first case imparts greater visibility to the editorial; in the second case, the editorial is just an introduction to a part of the annual report and more or less drowned out in a voluminous document. As compared to CSR information in financial reports, stand-alone CSR reports are unique and serve as a one-stop source of CSR performance information for stakeholders (Du and Yu, 2021). The editorial is therefore more salient and more readily accessible when published as the opening to a sustainable development report, hence:
H3: The positive impact of evoking CSR in the editorial on the firm’s inclusion in a sustainability index is strengthened when the editorial is published in a sustainable development report rather than in the CSR section of the annual report.
Readability of the editorial
Du and Yu (2021) show that a more readable text in a firm’s CSR report is indicative of a higher future CSR performance. This could also be applied to the editorial: an editorial that is unclear, confused or ambiguous will have less impact than one that is clear, specific and circumstantial. In the former instance, it might be thought that the firm is looking to mislead or distract readers, evoking impression management. On the contrary, the clearer the editorial, the more trustworthy it is felt to be; and if the firm can be specific, it is because it has valuable points it can communicate about. Moreover, clearly stated commitments can be easily evaluated at a later date: Are words reflected by deeds? Hence our final hypothesis:
H4: The positive impact of evoking CSR in the editorial on the firm’s inclusion in a sustainability index is strengthened when the editorial is highly readable.
Figure 1 details our conceptual model.
Figure 1
Conceptual model
Presentation of data and construction of variables
Data were hand-collected from sustainable reports of large French firms over the period 2003–2017. Given that some reports were unavailable, we ultimately hand-collected 437 editorials. The length of the observation period (15 years) is an advantage for observing complex mechanisms over the long term. To test for the efficacy of the signal conveyed by sustainable editorials, a long period of time is necessary. The case of France is therefore suitable for investigating the long-term effect of signalling. It was a pioneer in sustainable reporting, far ahead of the European Directive (2013/34/EU) on the reporting of non-financial information and information related to diversity for some big companies and major groups. The empirical analysis covers the CAC 40 companies (40 largest capitalizations in France) for which we have CSR reports for the period 2003–2017. Where no report is available, we used the section of the annual report covering CSR or sustainable development. Financial firms (banking, insurance, real estate) were omitted from the sample because of their specific constraints and accounting requirements. After applying these filters, we possessed data on 35 firms over 15 years. Given that some reports were unavailable, we ultimately worked on 437 firm-year observations. Our sample is comparable in size to those in recent empirical studies using annual reports (Patelli and Pedrini, 2015; Boudt and Thewissen, 2019). Table 1 sets out the structure of the final sample. Table 1 shows that 15 GICS industry groups appear in the sample. Capital Goods is the best represented sector (22.85%).
Table 1
Sample distribution by sector of activity
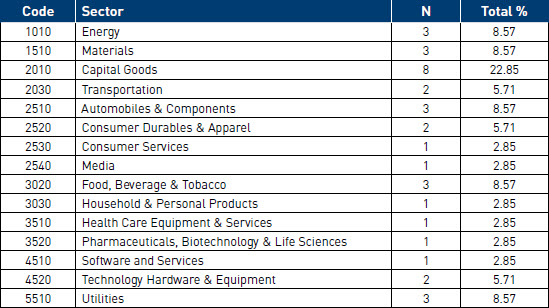
This table presents the sample distribution by sector. Classification by sector is based on GICS (Global Industry Classification Standard). N stands for the number of companies in each sector of activity and Total % stands for the percentage of firms belonging to each sector of activity.
The data used in this paper come from various sources. Accounting and financial data were collected from the Worldscope and Datastream databases, respectively, which are in turn supplied by the Thomson One Reuters database. Data analysis of our dependent variable, inclusion in the DJSWI, is based on the sustainability evaluation provided by the extra-financial rating firm SAM (Sustainable Asset Management). Finally, the textual data are from the firms’ annual reports. We used editorials of sustainable development reports written in English for the textual analysis.
Textual analysis and definition of the independent variable EDITO
If, as suggested in the section on the development of our research hypotheses, the content of the editorial in the CSR activity report represents a reliable signal as to activities in terms of a firm’s sustainable development, then it will be very useful for decision-making for investors looking to invest in the firm. We argued above that a firm developing a sustainable development strategy consistent with Carroll’s principles should be a leader in CSR. This is why our central independent variable is designed to gauge whether the CSR policy described in the editorial of the CSR activity report fits in with the CSR principles set out by Carroll (1979). Duriau et al. (2007) review the literature on content analysis in management and the study of organizations. They state that only 24.5% of the articles studied (24 out of 98) report using computer-assisted textual analysis. Balvers et al. (2016) emphasize that automated textual analysis has grown significantly in recent years. For example, Patelli and Pedrini (2015) and Balvers et al. (2016) analyse the tone of language or the use of specific terms within corporate documents using computer-assisted content analysis.
Loughran and McDonald (2016) review the use of textual analysis in accounting and finance. They identify several ways of analysing text content. The simplest approach is to identify specific words or phrases defined in an ad hoc manner with the text. Loughran et al. (2009) analyse the ethical dimension of US companies’ annual reports (10-K reports). To do this, they count the occurrences of words or groups of words such as “social responsibility” or “socially responsible” or “ethics”.
This approach proves rather poor, which is why a second approach in a similar spirit is often used. This second approach relies on dictionaries, that is, predefined word lists. It is referred to as the “bags of words” approach. For example, the degree of optimism of a text can be evaluated by counting the number of words on a list of words with positive connotations (cf. Garcia, 2013).
A final approach based on Bayesian statistics uses definitions and so-called learning algorithms. Huang et al. (2014) use machine learning and a Bayesian algorithm to measure the sentiment expressed by financial analysts in their reports on firms. They manage in this way to classify 27 million sentences within categories of feelings. While a tool of the kind appears very alluring with respect to its capacity to analyse a very large corpus, one of its main failings is the resort to a degree of subjectivity. At the beginning of the process, humans have to teach the algorithm to classify sentences within categories. Researchers are asked to give an opinion about the sentiment (e.g. positive or negative) prompted by an expression. The sentences and researchers’ opinions are fed into the algorithm which is then able to classify a very large number of sentences.
Here we used a corpus made up of 437 introductory letters (editorials) to the CSR activity reports of the 35 largest French companies over a 15-year period (2003–2017). We opted to measure CSR dimensions within the meaning of Carroll (1979) using dictionaries. The most commonly used dictionaries are those incorporated in the DICTION or General Inquirer software—commonly used by management researchers in textual analysis. However, the dictionaries used in this software are proprietary and not publicly available, except for the Harvard IV-4 in General Inquirer. This public dissemination ensures ready replication of research and safeguards against any subjectivity by researchers (Loughran and McDonald, 2016).
Following Bernard et al. (2018), we use an approach based on the Harvard IV-4 dictionary to compute our independent variable EDITO.[2] EDITO assesses the extent to which a text conforms to the definition of CSR in the sense of Carroll (1979). First, we measure the four different dimensions of CSR (economic, legal, ethical and philanthropic) identified by Carroll (1979) using relative word counts for each dimension. Then, we use the weightings provided by Carroll (1979) and we calculate a textual measure of CSR à la Carroll. It is as follows:
The greater the variable EDITO (evocation of CSR within the meaning of Carroll in the editorial), the greater a firm’s CSR concerns are thought to be for the year in question.
Dependent and control variables
Our dependent variable is based on the evaluation of CSR performance, namely the firm’s inclusion in the DJSWI. We created a dummy variable (INCi,t) that takes the value 1 if the company is included in the DJSWI in year t and 0 otherwise. In our sample, we counted 176 entries and 349 exits. Analysis of our annual data supplied by Sustainable Asset Management shows that just one firm never left the DJSWI since its entry in 2003, two firms in our sample never made it into the DJSWI, and therefore 32 companies occasionally featured in the DJSWI (at least one year) over our study period 2003–2017. We use as control variables the determinants of corporate sustainability performance traditionally used in the literature, namely firm characteristics (firm size, profitability, leverage and growth opportunity), sectoral effects and time effects (Artiach et al., 2010).
Moderator variables
We are also interested in any moderating impact of the author of the editorials in the main relationship (posited by H1) by way of our second hypothesis (H2). We therefore created a dummy variable (CEO) which takes the value 1 if the editorial author is the CEO and 0 otherwise. Similarly, the moderating impact of the type of medium of the editorial on the main relationship (H1) is studied by creating a binary variable SD, which is 1 if the editorial used is published in a sustainable development (or integrated) report and 0 otherwise (annual report). Finally, the moderating effect of the readability of the discourse on the main relationship (H1) is analysed by using the metric for readability proposed by Gunning (1952)—the Fog index, also sometimes referred to as the Gunning-Fog index. This metric is generally used in the literature to evaluate the readability of firms’ annual reports (Bushee et al., 2018).
The Fog index is calculated as follows:
Where Total words is the total number of words in an editorial, Total sentences, the total number of sentences in an editorial, and Complex words, the total number of words in a given editorial running to more than two syllables. The FOG index evaluates the readability of a text written in English. The higher the index value, the more difficult the text is to understand and especially by people who have not been through higher education. It is considered that an index of more than 13 means a text can be read by a secondary school graduate and an index of 17 presupposes a university degree for it to be understood.
In our sample, the mean of the FOG index (18,629) attests to rather low readability of the introductory texts of sustainable development reports or annual reports. Since the mean is an indicator of trend, it appears that some firms (e.g. Publicis Groupe or Renault) produce texts that can be more easily understood than texts by other firms (e.g. Kering or Vivendi). The introduction of this moderating variable can therefore indicate whether the readability of texts disseminated among the public influences the predictive character of CSR performance editorials (H4).
Table 2
Descriptive statistics of variables used in the study
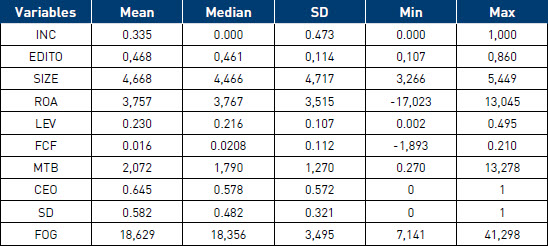
This table presents the basic descriptive statistics for the main variables in the study for the period 2003–2017. INC is a variable representing the firm’s inclusion in the Dow Jones Sustainability World Index and is 1 if the firm is in the DSJWI and 0 otherwise. EDITO is a variable representing editorial content within the meaning of Carroll. SIZE represents company size measured by the logarithm of total assets. ROA is the return on assets measured by the ratio between pre-tax profits, taxes and interest and the total assets. LEV is the company’s debt measured by the total liabilities divided by total assets. FCF is the ratio between free cash-flow and total sales. MTB is the market-to-book ratio measured by the ratio between the stock-market value and the book value of company equity. The variable CEO is a binary variable that takes the value 1 if the editorial is signed by the CEO and 0 otherwise. SD is a binary variable that is 1 if the editorial is published in a sustainable development report and 0 otherwise. The FOG variable is a readability index of editorials in CSR reports used in our study.
Table 2 presents the descriptive statistics of the main variables used in our study. Over the period 2003–2017, one-third of the firms in our sample featured in the DJSWI. This is not stable over time because most firms enter and exit the index regularly. The control variables related to firm characteristics have values consistent with previous articles regarding the determinants of corporate sustainability performance (e.g., Artiach et al., 2010). The moderator variables provide some interesting information: close to two-thirds of editorials are signed by CEOs and nearly 60% of firms produced specific reports during the period. Since the means are for all firms over the entire period, they mask the fact that, over a recent period, editorials are more often signed by CEOs and firms tend increasingly to produce a specific sustainable development report, that it is not incorporated into the annual report.
Table 3
Correlation matrix
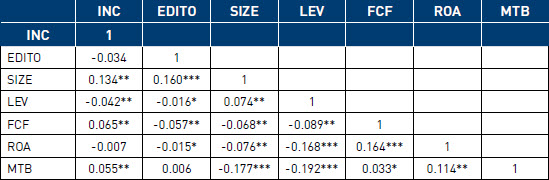
This table shows the Pearson correlation coefficients between the variable INC and the explanatory variables for the period 2003–2017. INC is a variable representing the firm’s inclusion in the Dow Jones Sustainability World Index and is 1 if the firm is in the DSJWI and 0 otherwise. EDITO is a variable representing editorial content within the meaning of Carroll. SIZE represents company size measured by the logarithm of total assets. ROA is the return on assets measured by the ratio between pre-tax profits, taxes and interest and the total assets. LEV is the company’s debt measured by the total liabilities divided by total assets. FCF is the ratio between free cash-flow and total sales. MTB is the market-to-book ratio measured by the ratio between the stock-market value and the book value of company equity. ***, **, and * indicate the 1%, 5%, and 10% significance levels, respectively.
Table 3 presents the correlations among the different variables. It brings out a variable degree of correlation between the CSR performance metric (INC) and the explanatory variables selected. All of the correlation coefficients display the expected sign, except for the ROA variable, which has an unexpected negative coefficient. One explanation for this negative relationship may be that companies involved in CSR have to make costly investments which have a negative impact on their economic performance.
The highest correlation is between the CSR performance metric and firm size (13.4%). The lowest correlation is between INC and ROA, and it is not significant. The correlations between the other explanatory variables are low (less than 0.2), so any multicollinearity problem can be dismissed.
Empirical methods of analysis and results
Method of analysis
Our purpose is to test the capacity of the evocation of CSR within the meaning of Carroll in editorials to predict the firm’s inclusion in a sustainability index. Accordingly, we test our independent variable INCi,t by regressing it on variables that might explain the CSR performance, in the case in point, the variables representing the company characteristics traditionally used in the literature and the variable representing the evocation of CSR within the meaning of Carroll in report editorials. The impact of explanatory variables on CSR performance is evaluated using a logit model with panel data. From this perspective, it takes time for the CSR policy evoked in editorials to have an effect. In our model, therefore, the variable EDITO is offset with respect to the variable for CSR performance. It is important to point out that in trying to estimate the probability of the variable INCi,t being 1, we estimate the capacity of our variable for evocation of CSR within the meaning of Carroll in editorials to predict the company’s inclusion in the DJSWI over a horizon k. More specifically, we estimate the specification of the following logit model:
Where INCi,t is the vector
of binary variables representing the firm’s inclusion in the DJSWI defined previously,
Xk is the matrix of the control
variables, αk is the vector of
coefficients to be estimated, and f stands for
the type logistic function: ![]() . k is the forecasting
horizon[3].
. k is the forecasting
horizon[3].
An empirical problem arises when we wish to estimate the econometric model of our study, namely the forecast horizon to be taken into account. Estimating the basic empirical model involves determining beforehand the number of lags k. In other words, it is a matter of identifying the time delay with which the content of editorials influences the firm’s inclusion in the DJSWI. The theoretical literature does not specify any forecast horizon. In an effort to answer the question empirically, we opted to present the results of the logistic regression over forecast horizons ranging from k = 1 to 5 years.
Results from the estimation
We present in turn the results of regressions of three different specifications of the logit model (cf. tables 4 and 5). In the first model (table 4), we consider only the variable for the capacity of evoking CSR within the meaning of Carroll in the report editorials. In the second model (table 5), only the variables representing the characteristics of firms are used as explanatory variables. Lastly, the third model (table 5) is made up of variables characteristic of firms and the variable representing the capacity for evocation of CSR within the meaning of Carroll in the editorials of sustainable development reports. Our objective in this work, it should be recalled, is to test the incremental predictive power of the variable EDITO compared with that of the variables commonly used in the literature.
Predictive power of the variable representing the capacity for evoking CSR
Table 4 presents the results of the logit regression for panel data with fixed effects by year and sector of activity. It can be seen that editorial content has a positive but non-significant effect as from the first year on the probability of the firm being included in the DJSWI. The positive effect intensifies for the second, third, and fourth years, peaking in the third year. For this horizon k = 3, the positive effect of editorial content on the probability of the firm being included in the DJSWI is significant at the 5% level. In other words, the greater the evocation of CSR within the meaning of Carroll in editorials, the greater the probability of the firm being included in the DJSWI in the next three years. It can also be observed that beyond the fourth year the effect fades and becomes non-significant.
Table 4
Results of the fixed-effects logit model regression for panel data
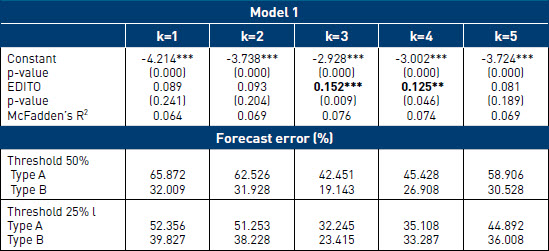
This table presents the result of estimation of the fixed-effects logit model regression for panel data (years and sectors) using as the only explanatory variable editorial content within the meaning of Carroll in CSR reports (Model 1). The dependent variable takes the value 1 if the firm is included in the Dow Jones Sustainability World Index and 0 otherwise. k is the selected forecast horizon. Type A is the percentage of inclusions of firms in the DJSWI without any signal being emitted. Type B is the percentage of false alerts among all the signals. ***, **, and * are the 1%, 5%, and 10% significance levels, respectively.
McFadden’s R2 statistic of the first model—which is supposed to provide coefficients comparable to the percentage of explained variance of the ordinary multiple regression—is 7.6% for the horizon k = 3. Moreover, the results show that the percentage of correct predictions of firms’ inclusion in the DJSWI is high. The Type A error rate (percentage of unpredicted inclusions in the DJSWI) stands at 32% and 42% respectively at the 50% and 25% levels. Consequently, the model correctly predicts about 68% and 58% of inclusions in the DJSWI at the critical levels of 50% and 25%. It should be noted that the percentage of type B errors (false alerts) is comparatively low for the two critical limits. Our results appear relevant, which is why we use the time scale of three years (k = 3) in the empirical analyses that follow.
Explanatory power of the control variables
The results of estimating the second model are set out in table 5. They show that all of the selected explanatory variables are statistically significant and have the expected signs, with the exception of the variable ROA, which is not significant, in line with existing results. Numerous publications in recent years have studied the link between social responsibility and corporate performance (e.g., Zhao and Murell, 2016). These studies show contradictory results that do not clearly establish the existence of a link and whether this link is positive or negative.
Overall, the model is statistically robust. The maximum likelihood statistic confirms the overall quality of fit of the model. The joint null hypothesis of all the regression coefficients, except for the constant, is rejected. Moreover, McFadden’s R2 statistic is 31.2%, suggesting the regression is of good quality. The model correctly accounts for 65% and 70% of inclusions of firms in the DJSWI at the 50% and 25% levels, respectively. The percentage of type B errors is comparatively low, at between 15% and 21%.
Table 5
Results of the regression for panel data with fixed effects in the presence of control variables and the moderator variables
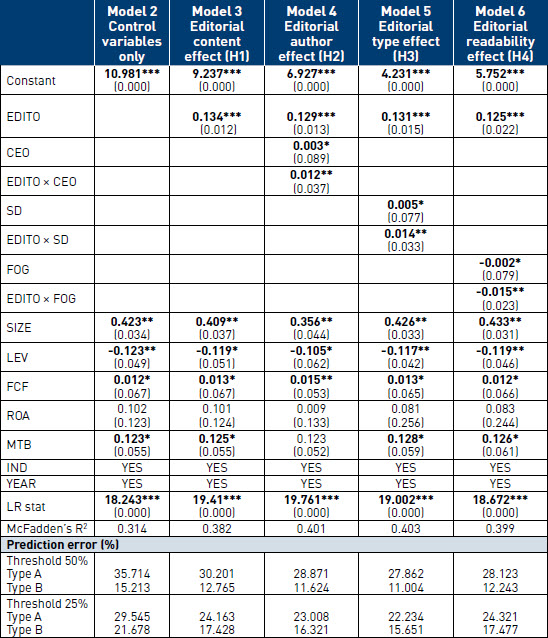
This table presents the result of estimation of the fixed-effects logit model regression for panel data (years and sectors). Model 2 includes the control variables only whereas model 3 includes both the control variables and the variable of editorial content within the meaning of Carroll in CSR activity reports. Model 4 incudes a variable for EDITO × CEO interaction. Model 5 is used to test the moderating role of the type of editorial. Models 6 and 7 are used to test the moderating role of editorial readability. The dependent variable (INC) takes the value 1 if the firm is included in the Dow Jones Sustainability World Index and 0 otherwise. The variable CEO is a binary variable that is 1 if the editorial is signed by the CEO and 0 otherwise. SD is a binary value that is 1 if the editorial used is published in a sustainable development report and 0 otherwise. FOG is the readability index of the report editorials used in our study. IND is a dummy variable that captures the sector activity effects. YEAR is a dummy variable that captures time effects. Type A is the percentage of inclusions of firms in the DJSWI without any signal being emitted. Type B is the percentage of false alerts among all the signals. ***, **, and * are the 1%, 5%, and 10% significance levels, respectively.
Incremental predictive power of the variable EDITO
The results from estimating the third model show that the variable representing the capacity of evocation of CSR within the meaning of Carroll in report editorials remains significant, even after controlling for the effect of the control variables associated with the characteristics of firms and sectors of activity. The complete model provides very satisfactory results both in terms of the quality of the regression and the quality of forecasting. The inclusion of the variable EDITO improves the statistical quality of the basic model. McFadden’s R2 statistic increases further to the addition of the variable representing the evocation of CSR within the meaning of Carroll; it provides a gain in explanatory power of the order of 6.8%. As for performance in terms of prediction, the complete model outperforms the second model. It correctly predicts 70% and 76% of inclusions of firms in the DJSWI at the critical levels of 50% and 25%, respectively.[4] It is worth noting, too, that the percentage of type B errors is lower than in the second model, standing at 12% and 17%.
In conclusion, the variable EDITO provides incremental predictive power compared with that of other explanatory variables regularly used in the literature. Consideration of the evocation of CSR within the meaning of Carroll in editorials, in addition to the variables associated with the characteristics of firms and activity sectors, improves the predictive and discriminatory power of our alert model and proves effective for predicting the inclusion of firms in the DJSWI at a three-year horizon, which means hypothesis H1 can be accepted.[5]
Moderating effect of the editorial being signed by the CEO
Hypothesis H2 predicts that the identity of the editorial authors (CEO or top manager) should moderate the influence of evocation of CSR within the meaning of Carroll in editorials on the inclusion of firms in the DJSWI. To test this hypothesis, we need therefore to include the direct effects of influence of the variable “editorial author” (CEO) in the basic model. Model 4 (table 5) therefore uses the control variables, the EDITO within the meaning of Carroll, the variable “editorial author” (CEO), and the interaction between these last two variables. Estimation of this model provides comparable results to models 1 and 2 with respect to the control variables. McFadden’s R2 statistic is 40.1%, showing the quality of the regression. The results reveal a high percentage of correct predictions of firms’ inclusion in the DJSWI. Type A errors are low showing that the model predicts correctly 71% (threshold 50%) and 77% (threshold 25%) of the firms’ inclusion in the DJSWI. Note also that type B errors are relatively low for the two thresholds (11,624% when the threshold is 50% and 16,321% when the threshold is 25%).
For the explanatory variables, it is noticeable that the variable EDITO and the variable “editorial author” (CEO) have positive and significant effects on CSR performance, which is fully consistent with our previous results. Furthermore, in keeping with H2, it can be seen that the interaction between the variable EDITO and the variable CEO has a significant and positive effect. This means that the impact of editorial content on the inclusion of firms in the DJSWI in the next three years is greater when the editorials are signed by the CEO. This result validates the importance of a strong and more visible signal through the CEO’s signature (higher level of observability) for a positive impact of editorial content on CSR performance, which confirms H2.
Moderating effect of the medium for the editorial
Our hypothesis H3 provides that the impact of the variable EDITO on the firm’s inclusion in a sustainability index increases when the editorial is published in a report devoted exclusively to sustainable development or an integrated report compared with a “conventional” annual report. To test this hypothesis, we have included in model 5 (table 5) an interaction variable between the variable EDITO and the binary variable SD which is 1 if the editorial is published in a sustainable development (or integrated) report and 0 otherwise (annual report). We observe that the interaction between the variable EDITO and the variable SD has a significantly positive effect at the 5% level. This means that the impact of the content of editorials within the meaning of Carroll on firms’ inclusion in the DJSWI is higher when the editorial is published in a report devoted to sustainable development, which confirms hypothesis H3.
This moderating effect can be explained by the signal becoming stronger because the editorial is more salient and more readily accessible when published at the beginning of a sustainable development report rather than being just the introduction to the CSR section in an annual report (higher level of observability). The model displays good results. The introduction of the interaction variable (EDITO × SD) improves the statistical quality of the model; the McFadden R2 gains about 2.1% when compared to the first model. The model also correctly predicts 73% and 78% of the firms’ inclusion in the DJSWI at thresholds of 50% and 25%. It is noticeable, too, that the percentages for type A and B errors are lower than in model 3, which confirms hypothesis H3.
Moderating effect of the readability of editorials
Our hypothesis H4 states that the impact of the variable EDITO on the firm’s inclusion in a sustainability index increases as the readability of the editorial increases. To test this moderating effect, model 6 includes a variable of interaction between the variable EDITO and a variable measuring the readability of the editorial. Readability is measured by the Fog readability index (table 5).
The results of the estimation of model 6 show that the interaction variable (EDITO × Fog) is negative and statistically significant at the 5% level. In other words, the positive impact of the variable EDITO on the firm’s being included in the DJSWI is strengthened when the editorials are readable (low Fog index), which strengthens hypothesis H4. This moderating effect can be explained by the fact that the signal grows stronger when the editorial is clear, precise and circumstantiated (higher level of observability). The model correctly predicts 72% and 76% of inclusions in the DJSWI at thresholds of 50% and 25% and the percentages of type B errors are low (12,243% when the threshold is 50% and 17,477% when the threshold is 25%).
Discussion and conclusion
Our results show that sustainable development reports (or integrated reports) make it possible to predict the inclusion (or non-inclusion) of a firm in a sustainability index. More specifically, we show that the evocation of CSR dimensions in the editorials of these reports is a leading indicator of a firm’s inclusion in or exclusion from the DJSWI. The predictive power of the editorials is reinforced when they are signed by the CEO, published in a sustainable development (or integrated) report (compared with publication in an annual report), and written clearly and readably.
Our paper contributes to the debate between incremental information theory and impression management theory in providing results in favour of the former. In the incremental information strand, the information disclosed is relevant information for improving investors’ decision-making. In this case, the choices made by the manager as to the disclosure of information contribute to reducing information asymmetry and at the same time allow pertinent decision-making. Beyond the variables classically selected (company size, financial performance, sector of activity), the editorials of sustainable development reports convey incremental information that can be used to improve predictions about the inclusion (or exclusion) of the firm in a sustainability index. This observation argues for a degree of sincerity of the editorials, in contrast to a purely strategic use of such texts in a rationale of impression management. Our results are consistent with those of Muslu et al. (2019) who highlight that sustainable development reports enable financial analysts to improve their predictions. Our out-of-sample results confirm the robustness of our findings: our model is able to predict the inclusion of the vast majority of the firms in the DJSWI.
Being rooted in signalling theory, this research suggests that it is relevant to consider the report editorials as costly signals. They are that much more efficacious because they can be readily observed. Accordingly, the very fact that a lack of sincerity would expose the firm and the signatory to deferred penalty costs suffices to confer on them the status of costly signals. It is considered, then, that the CEO’s discourse in the editorial will signal information about the quality and intent of the CSR strategy to investors in such a way as to reduce uncertainty and make it possible to predict the firms being included in or excluded from a sustainability index. It will be noticed that the empirically established lag in this study is of three years; accordingly, stakeholders will have to wait three years before observing any decoupling between the editorial content and the firm’s actual CSR performance as manifested by its inclusion or non-inclusion in the sustainability index. This research also confirms the relevance of Carroll’s CSR approach and in particular the decreasing weighting of his four dimensions.[6]
In terms of method, this research mobilizes a methodology used by economists at the World Bank and IMF (early warning signals) to predict the occurrence of banking and foreign exchange crises. To the best of our knowledge, this is the first time such a method has been used in the CSR area. Moreover, this research contributes to signalling theory by proposing an operationalization of the observability of a signal through three indicators (author of the signal, type of document, readability). Lastly, the research proposes an original approach for lexicometric measurements of the evocation of CSR, which can be easily reproduced, and opens up a pathway for future work.
The managerial implications of this research concern listed companies first of all. As the editorials of sustainable development (or integrated) reports can be analysed as costly signals, it is in the interest of their authors to be sincere and clear when writing them, so as to avoid deferred costs (exclusion from a sustainability index, negative reputation, etc.). Firms genuinely committed to making significant efforts with respect to CSR should opt to publish a sustainable development (or integrated) report and confer on the CEO the job of writing the editorial, which should be presented in a clear, precise and circumstantial way.
From the point of view of socially responsible investors (SRIs), this research emphasizes that it is worth considering an additional component when evaluating firms. In addition to taking account of the firm’s financial performance, its size, its sector, and so on, SRIs might improve the quality of their predictions by including the content of sustainable development report editorials. Furthermore, better predicting firms’ inclusion in or exclusion from sustainability indices is important for SRIs since firms’ share prices may react to their inclusion in sustainability indices including the DJSWI (Oberndorfer et al., 2013). Sustainable development report editorials are a leading indicator of CSR performance. Using this incremental information to identify early on those firms that are highly likely to be included in a sustainability index—and also for disinvesting rapidly from those firms that are in danger of exiting such indices—is of interest on two counts. For SRIs it improves the quality of their investments both in terms of CSR performance and financial profitability. For firms it seems to imply a reward for the more ethical—in the form of being more attractive to investors—and a penalty for the less ethical—in the form of an outflow of SRIs. It can therefore be concluded that the results of this research have managerial implications that are potentially favourable to firms’ ethical behaviour.
Our research is not without limitations. First, just a single sustainability index has been considered (the DJSWI). It would therefore seem appropriate to replicate our approach using other indicators as dependent variables. Moreover, the automated textual metrics used in this study to quantify the evocation of CSR dimensions in the editorials fail to capture the subtlety of the discourse and the rhetorical effects in the editorials. This metric may be far removed from the actual forms of text analysis employed by SRIs or other stakeholders. Their evaluation is also probably influenced by the graphic presentation of the editorial, the use of photographs, etc. A multi-dimensional evaluation of editorials might therefore enhance future work.
Our work also points to some areas for future research. Two paths seem promising. First, other predictors of the firm’ inclusion in a sustainability index could be investigated. For example, alternative CSR disclosure methods, such as communication on corporate websites (text, image, content, etc.), but also comments posted by third parties on social media like Twitter. Second, we have shown the importance of the CEO through his or her signature on the editorial as an indicator of the quality of the firm’s commitment to CSR. To extend our research, it would be worthwhile further investigating the role of the CEO through a closer examination of the CEO’s personality, in particular by examining CEO ethical leadership and its influence on corporate social responsibility and the firm’s inclusion in a sustainability index.
Parties annexes
Appendix
Appendix 1. Measure of the independent variable EDITO
To define the variable EDITO, we used the word lists consistent with the four dimensions defined by Carroll (1979) and categorized within the Harvard IV-4 English dictionary. Next, we counted the number of occurrences of these words in the report editorials. We therefore mobilized sustainability reports written in English. We detailed the lists of words used for each CSR dimension within the meaning of Carroll:
Economic: we used the categories[7] “econ@” and “ECON”. There were 480 words in all. The two categories contain words with an economic or commercial meaning or a business orientation.
Legal: 173 words. The category “Legal” includes terms relating to legal, judicial, or police issues.
Ethical: 139 words. The list “Rcethic” is made up of words relating to the social and ethical register.
Philanthropic: to establish a word list, we associated two sets of terms because it is the most discretionary of Carroll’s four dimensions. We associated the categories “socrel” and “positive”. This yielded a list of 134 words. We performed the same operation for the categories “virtue” and “positive” and obtained an additional 536 words. All told, we had a list of 670 words. As Carroll (2016) points out, “this category is often thought of as good ‘corporate citizenship’”. Accordingly, we rely on words of a positive character and that also belong to the category “socrel”. This category relates to socially defined interpersonal processes. We used the same reasoning to select words with positive connotations from the category “virtue” that identify words associated with a form of moral approbation.
Next, for each editorial, we identified the number of words in each of the lists.
In order to avoid a size effect, we adjusted our measurements to scale by dividing them by the total number of words in the text in which they occur. For example, the measurement of the legal dimension corresponds to the number of words of an editorial included in the list of “Legal” words defined above and divided by the number of words in that same editorial. These measurements are calculated for each firm and each year. Formally, they are as follows for a company i at a date t:
ECONOMIC DIMENSIONi,t = Number of words belonging to the category "econ@" or "ECON"i,t / Total number of wordsi,t
LEGAL DIMENSIONi,t = Number of words belonging to the category "legal"i,t / Total number of wordsi,t
ETHICAL DIMENSIONi,t = Number of words belonging to the category "Rcethic"i,t / Total number of wordsi,t
PHILANTROPIC DIMENSIONi,t = Number of words at the intersection of the categories "socrel" and "positiv" " or of the categories "virtue" and "positiv"i,t / Total number of wordsi,t
The higher any of these scores is, the more likely it is that the editorial in question mentions the relevant CSR dimensions within the meaning of Carroll.
We evaluate the logit model’s forecast performances using the signalling approach (Demirguc-Kunt and Detragiache, 2000). By estimating the logit model, a predicted probability of the firm’s inclusion in the sustainability index can be attributed. The model’s performances are then measured by comparing this predicted probability with the actual occurrence of inclusion in the sustainability index within our sample. Indeed, one needs to compare this predicted probability of firms’ inclusion in the DJSWI obtained from the model (1) with the actual probability. Since the latter is not directly observable, one needs to compare the predicted probability with the actual occurrence of firms’ inclusion in the DJSWI. As the predicted probability is a continuous variable, a necessary step consists in defining a threshold probability above which it is decided that a firms’ inclusion in the DJSWI is predicted by the model.
Four types of situations may generally occur. These are set out in table below. We can identify two types of error corresponding to the table’s second diagonal. For the type A error, the model fails to detect the firm’s inclusion in the DJSWI whereas for the type B error, it wrongly identifies the firm’s inclusion in the DJSWI, which does not occur in our sample. A good leading indicator should accordingly not just detect the firm’s inclusion in the DJSWI, but also it should not produce frequent false alerts. Type A and B errors should therefore be minimized, which amounts to maximizing correct predictions. The predictive performances of the logit model depend largely on the importance attributed to these two types of error.
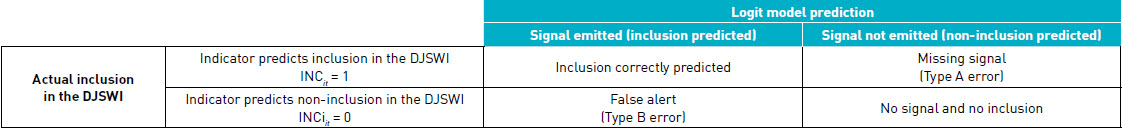
Moreover, the investor or decision-maker using this type of model should set the alert levels beforehand. A level of probability should be defined beyond which the predicted probability may be interpreted as a signal of the firm’s inclusion in the DJSWI. An unavoidable choice must then be made between the two types of error depending on the selected alert levels. The lower (higher) the alert level, the more (fewer) signals (firm’s inclusion in the sustainability index) there will be. Conversely, the number of false alerts will also be high (low). We present the results for alert levels set at 25% and 50%.
Biographical notes
Yohan Bernard is an associate professor in management sciences at the University of Franche-Comté, IAE department. He is a member of the CREGO laboratory where he is the co-head of the CERMAB research team. His work mainly focuses on the determinants of pro-environmental consumer behavior. He is more broadly interested in sustainable development and corporate social responsibility.
Laurence Godard is an associate professor in management sciences at the University of Franche-Comté, IAE department. She is a member of the CREGO research team. Her research work focuses on corporate governance (board of directors, strategic committees, CEO compensation, CEO turnover) and CSR.
Pr. Fabrice Herve is a full professor of Finance at IAE DIJON University of Burgundy School of Management in France. He is a member of the research laboratory CREGO (EA 7317). His research fields are behavioral finance, investor sentiment, crowdfunding and entrepreneurial finance.
Dr. Mohamed Zouaoui is an associate professor at School of Business Administration (IAE DIJON), University of Burgundy School of Management in France. He is a member of the research laboratory CREGO (EA 7317). His research fields are behavioral finance, asset pricing, investor sentiment and corporate social responsibility.
Notes
-
[1]
These weightings are set intuitively by Carroll (1979, p. 499): “[...]the social responsibilities can be categorized into the four groups. The proportions simply suggest the relative magnitude of each responsibility”). They were validated by Carroll in a follow-up study (Aupperle et al., 1985) and by other studies (Edmondson et al.,1999).
-
[2]
For sake of brevity, we describe the procedure in detail in Appendix 1 and only provide a brief description of the construction of the independent variable here.
-
[3]
The Appendix 2 presents the details for evaluating the model’s forecasting performance based on the type A error and type B error.
-
[4]
Our model displays good results as compared to literature related to stock market crises, banking crises and currency crises. For example, the empirical model of Coudert and Gex (2008) correctly predicts 64% of international stock market crises. The model of Bussiere and Fratzscher (2006) predicts 65% of currency crises for a set of 20 open emerging markets. The empirical results of Demirguc-Kunt and Detragiache (2000) reveal that 35% of banking crises have been correctly predicted for developing and developed countries.
-
[5]
To test whether our model is capable of predicting, outside of the sample, the inclusion of firms in the DJSWI, we re-estimated our complete model (model 1) for the period 2003–2014 for the purpose of testing its capacity to predict the inclusion of the 35 firms of our sample in the DJSWI in 2017 (complying with the three-year lag). The estimation results show that the model works well even out-of-sample at the 25% level. Our model predicts the inclusion in the DJSWI in 2017 of a large part of the firms of our sample. Moreover, the model also exhibits a relatively low number of false alerts. More specifically, our model fails to predict correctly the inclusion of only two firms out of a total of 19 in the DJSWI in 2017 (Alstom and Danone) and wrongly predicts the inclusion of two other firms out of a total of 16 in the DJSWI in 2017 (L’Oréal and Renault).
-
[6]
We obtain more relevant results (both in terms of quality of the regression and quality of prediction) when using an EDITO metric with weighting as in Carroll’s metric of CSR compared with a straightforward equally-weighted EDITO metric (same weighting for all four dimensions).
-
[7]
The categories are detailed at: http://www.wjh.harvard.edu/~inquirer/homecat.htm
The total number of words indicated here is lower than indicated on the website because we identify fewer words since, in the different categories, the same word sometimes appears several times. For example, in the category “rcethic”, the term “market” occurs twice (MARKET#1 and MARKET#2). The occurrence of inflections depends on the categorizations made in the dictionary. The same word is thus attached to different categories depending on its inflection.
Bibliography
- Al-Tuwaijri, S. A., Christensen, T. E., & Hughes Ii, K. E. (2004). The relations among environmental disclosure, environmental performance, and economic performance: a simultaneous equations approach. Accounting, organizations and society, 29(5-6), p. 447-471.
- Amernic, J.; Craig, R. (2006). “CEO-Speak: The Language of Corporate Leadership”, Mcgill-Queen’s University Press.
- Amernic, J., Craig, R.; Tourish, D. (2010). “Measuring and Assessing Tone at the Top Using Annual Report CEO Letters”, Institute of Chartered Accountants in Scotland.
- Arena, C., Bozzolan, S., & Michelon, G. (2015). Environmental reporting: Transparency to stakeholders or stakeholder manipulation? An analysis of disclosure tone and the role of the board of directors. Corporate Social Responsibility and Environmental Management, 22(6), p. 346-361.
- Artiach, T., Lee, D.; Nelson D.; Walker, J. (2010). “The determinants of corporate sustainability performance”, Accounting & Finance, 50(1), p. 31-51.
- Aupperle, K.E.; Carroll, A.B.; Hatfield, J.D. (1985). “An Empirical Examination of the Relationships between Corporate Social Responsibility and Profitability”, Academy of Management Journal, 28(2), p. 446-463.
- Balvers, R.J.; Gaski, J.F.; McDonald, B. (2016). “Financial disclosure and customer satisfaction—Do companies talking the talk actually walk the walk?”, Journal of Business Ethics, 139(1), p. 29-45.
- Beloe, S.; Scherer, J.; Knoepfel, I. (2004). “Values for money: reviewing the quality of SRI research. SustainAbility”, London, UK
- Bernard, Y., Godard, L., Hervé, F., & Zouaoui, M. (2018). “Les éditos des rapports de développement durable servent-ils à quelque chose? Une étude empirique de leur capacité à prédire la performance RSE”, Finance Contrôle Stratégie, (NS-4).
- Bird, R. B., & Smith, E. A. (2005). “Signaling theory, strategic interaction, and symbolic capital”, Current Anthropology, 46, p. 221-248.
- Boudt, K., & Thewissen, J. (2019). “Jockeying for position in CEO letters: Impression management and sentiment analytics”, Financial Management, 48(1), p. 77-115.
- Brammer, S. J., & Pavelin, S. (2006). Corporate reputation and social performance: The importance of fit. Journal of management studies, 43(3), p. 435-455.
- Bushee, B.J.; Gow, I.D.; Taylor, D.J. (2018). “Linguistic complexity in firm disclosures—Obfuscation or information?”, Journal of Accounting Research, 56(1), p. 85-121.
- Bussiere, M. & Fratzscher, M. (2006). “Towards a new early warning system of financial crises”, Journal of International Money & Finance, 25, p. 953-973.
- Carroll, A.B. (1979). “A three-dimensional conceptual model of corporate social performance”, Academy of Management Review, 4, p. 497-505.
- Carroll, A.B. (1991). “The Pyramid of Corporate Social Responsibility: Toward the Moral Management of Organizational Stakeholders”, Business Horizons, 34(4), p. 39-48.
- Carroll, A.B. (2016). “Carroll’s Pyramid of CSR: Taking Another Look”, International Journal of Corporate Social Responsibility, 1(3), p. 1-8.
- Certo, S. T., Daily, C. M., & Dalton, D. R. (2001). “Signaling firm value through board structure: An investigation of initial public offerings”, Entrepreneurship theory and practice, 26(2), p. 33-50.
- Clarkson, P.M.; Li, Y., Richardson, G.D.; Vasvari, F.P. (2008). “Revisiting the relation between environmental performance and environmental disclosure: an empirical analysis”, Accounting, Organizations and Society, 33(4-5), p. 303-327.
- Connelly, B.L.; Crerto, S.T.; Ireland, R.D.; Reutzel, C.R. (2011). “Signaling theory of the firm: A review and assessment”, Journal of Management, 37(1), p. 39-67.
- Coudert, V.; M. Gex. (2008). “Does risk aversion drive financial crises? Testing the predictive power of empirical indicators”, Journal of Empirical Finance, 15(2), p. 167-184.
- Courtis, J. K. (2004). “Corporate report obfuscation: artefact or phenomenon?”, The British Accounting Review, 36(3), p. 291-312.
- Demirguc-Kunt, A.; Detragiache, E. (2000). “Monitoring banking sector fragility: A multivariate logit approach”, The World Bank Economic Review, 14, p. 287-307.
- Du, S.; Yu, K. (2021). “Do corporate social responsibility reports convey value relevant information? Evidence from report readability and tone ”, Journal of Business Ethics, 172(2), p. 253-274.
- Duriau, V.J.; Reger, R.K.; Pfarrer, M.D. (2007). “A content analysis of the content analysis literature in organization studies: Research themes, data sources, and methodological refinements”, Organizational Research Methods, 10(1), p. 5-34.
- Edmondson, V.C.; Carroll, A.B. (1999), “Giving back: an examination of the philanthropic motivations, orientations and activities of large black-owned businesses”, Journal of Business Ethics, 19, 2, p. 188-205.
- Fanelli, A.; Grasselli, N. I. (2006). “Defeating the Minotaur: The construction of CEO charisma on the US stock market”, Organization Studies, 27(6), p. 811-832.
- Fowler, S. J., & Hope, C. (2007). A critical review of sustainable business indices and their impact. Journal of Business Ethics, 76(3), p. 243-252.
- Garcia, D. (2013). “Sentiment during recessions”, The Journal of Finance, 68(3), p. 1267-1300.
- Global Reporting Initiative. (2015). Sustainability and reporting trends in 2025: Preparing for the future. The Netherlands.
- Gunning, R. (1952). “The technique of clear writing”, McGraw-Hill, New York.
- Hąbek, P.; Wolniak, R. (2016). “Assessing the quality of corporate social responsibility reports: the case of reporting practices in selected European Union member states”, Quality & Quantity, 50(1), p. 399-420.
- Huang, A., Zang, A., and Zheng, R. (2014). “Evidence on the information content of text in analyst reports”, The Accounting Review, 89, p. 2151-80.
- Janney, J. J., & Folta, T. B. (2006). “Moderating effects of investor experience on the signaling value of private equity placements”, Journal of Business Venturing, 21(1), p. 27-44.
- Johnson, R.A.; Greening, D.W. (1999). “The effects of corporate governance and institutional ownership types on corporate social performance”, Academy of Management Journal, 42(5), p. 564-576.
- Khan, A.; Muttakin, M.B.; Siddiqui, J. (2013). “Corporate governance and corporate social responsibility disclosures: evidence from an emerging economy”, Journal of Business Ethics, 114, p. 207-223.
- KPMG (2017) The Road Ahead: The KPMG Survey of Corporate Responsibility Reporting 2017. KPMG International.
- López, M.V.; Garcia, A.; Rodriguez, L. (2007). “Sustainable development and corporate performance: A study based on the Dow Jones sustainability index”, Journal of Business Ethics, 75(3), p. 285-300.
- Loughran, T.; McDonald, B. (2016). “Textual analysis in accounting and finance: A survey”, Journal of Accounting Research, 54(4), p. 1187-1230.
- Loughran, T., McDonald, B., and Yun, H. (2009), “A wolf in sheep’s clothing: The use of ethics-related terms in 10-K reports”, Journal of Business Ethics, 89 (1), p. 39-49.
- Mäkelä, H.; Laine, M. (2011). “A CEO with many messages: Comparing the ideological representations provided by different corporate reports”, Accounting Forum, 35(4), p. 217-231.
- Marquis, C.; Toffel, M.W.; Zhou, Y. (2016). “Scrutiny, norms, and selective disclosure: A global study of greenwashing”, Organization Science, 27(2), p. 483-504.
- Melloni, G.; Caglio, A.; Perego, P. (2017). “Saying more with less? Disclosure conciseness, completeness and balance in Integrated Reports”, Journal of Accounting and Public Policy, 36(3), p. 220-238.
- Merkl-Davies, D. M., & Brennan, N. M. (2007). Discretionary disclosure strategies in corporate narratives: incremental information or impression management?. Journal of accounting literature, 27, p. 116-196.
- Muslu, V.; Mutlu, S.; Radhakrishnan, S.; Tsang, A. (2019). “Corporate social responsibility report narratives and analyst forecast accuracy”, Journal of Business Ethics, 154(4), p. 1119-1142.
- Oberndorfer, U.; Schmidt, P.; Wagner, M.; Ziegler, A. (2013). “Does the stock market value the inclusion in a sustainability stock index? An event study analysis for German firms”, Journal of Environmental Economics and Management, 66(3), p. 497-509.
- Patelli, L.; Pedrini, M. (2014). “Is the optimism in CEO’s letters to shareholders sincere? Impression management versus communicative action during the economic crisis”, Journal of Business Ethics, 124(1), p. 19-34.
- Patelli, L.; Pedrini, M. (2015). “Is tone at the top associated with financial reporting aggressiveness?”, Journal of Business Ethics, 126(1), p. 3-19.
- Sadowski, M.; Whitaker, K.; Buckingham, F. (2010). “Rate the Raters: Phase Two—Taking Inventory of the Ratings Universe”, Sustainability. London, UK,
- Utopies (2012), “Sustainability Reporting at Crossroads”, Reporting Trends Survey 2012, Utopies.
- Vishwanathan, P.; Van Oosterhout, H.J.; Heugens, P.P.M.A.R., Duran, P.; Van Essen, M. (2019). “Strategic CSR: a concept building Meta-Analysis”, Journal of Management Studies.
- Wood, D.J.; Jones, R.E. (1996). “Research in corporate social performance: what have we learned?”, In Corporate Philanthropy at the Crossroads, ed. D. R. Burlingame and D. R. Young (Bloomington, Ind.: Indiana University Press), p. 41-85.
- Zhao, X. & A.J. Murrell. “Revisiting the corporate social performance-financial performance Link: a replication of Waddock and Graves”, Strategic Management Journal, 37, p. 2378-2388.
- Ziegler, A.; Schröder, M. (2010). “What determines the inclusion in a sustainability stock index? A panel data analysis for European firms”, Ecological Economics, 69(4), p. 848-856.
Parties annexes
Notes biographiques
Yohan Bernard est Maître de Conférences habilité à diriger des recherches en Sciences de gestion et du management à l’Université de Franche-Comté, département IAE. Il est membre du laboratoire CREGO au sein duquel il co-dirige l’équipe CERMAB. Ses travaux portent principalement sur les déterminants des comportements pro-environnementaux des consommateurs. Il s’intéresse plus largement au développement durable et à la responsabilité sociale des entreprises.
Laurence Godard Docteur en Sciences de gestion et HDR, elle est maître de conférences à l’Université de Franche-Comté. Elle est membre de l’équipe de recherche du CREGO. Ses travaux de recherche portent essentiellement sur la gouvernance des entreprises (conseil d’administration, comités stratégiques, rémunération des dirigeants, changements des dirigeants) et la RSE.
Fabrice Herve est Professeur en sciences de gestion à l’IAE DIJON – Ecole Universitaire de Management. Il appartient au laboratoire de recherche CREGO (EA 7317). Il est l’auteur ou co-auteur de plusieurs articles portant sur la finance comportementale, le sentiment des investisseurs, la finance entrepreneuriale et le crowdfunding.
Mohamed Zouaoui est maître de conférences en sciences de gestion à l’institut d’administration des entreprises de DIJON (IAE DIJON) – Ecole Universitaire de Management. Il appartient au laboratoire de recherche CREGO (EA 7317). Il est l’auteur ou co-auteur de plusieurs articles portant sur la finance comportementale, l’évaluation des actifs financiers, le sentiment des investisseurs et la responsabilité sociale des entreprises.
Parties annexes
Notas biograficas
Yohan Bernard es Profesor Asociado del Instituto de Administración de Empresas – IAE de la Universidad de Franche Comté, y está habilitado a dirigir investigaciones en Ciencias de Gestión y Administración. Es miembro del Laboratorio CREGO, donde es co-director del equipo de investigación del CERMAB. Su trabajo se centra principalmente en los factores determinantes del comportamiento del consumidor pro-medioambiental. Él está interesado en el desarrollo sostenible y la responsabilidad social corporativa.
Laurence Godard es Doctora en Ciencias de Gestión y Profesora Asociada en la Universidad de Franche-Comté. Es miembro del equipo de investigación de CREGO. Su trabajo de investigación se centra en el gobierno corporativo (consejo de administración, comités estratégicos, remuneración de los ejecutivos, cambios en los ejecutivos) y la RSC.
Fabrice Herve es Profesor de Ciencias de la Gestión en el IAE DIJON - Escuela Universitaria de Administración. Pertenece al laboratorio de investigación CREGO (EA 7317). Es autor y co-autor de varios artículos sobre finanzas conductuales, sentimiento de los inversores, finanzas empresariales y crowdfunding.
Mohamed Zouaoui es Profesor Asociado de Gestión en el Instituto de Administración de Empresas (IAE) de Dijon. Es autor y co-autor de varios artículos sobre finanzas del comportamiento, valoración de los activos financieros, sentimiento de los inversores y responsabilidad social corporativa.
Liste des figures
Figure 1
Conceptual model
Liste des tableaux
Table 1
Sample distribution by sector of activity
This table presents the sample distribution by sector. Classification by sector is based on GICS (Global Industry Classification Standard). N stands for the number of companies in each sector of activity and Total % stands for the percentage of firms belonging to each sector of activity.
Table 2
Descriptive statistics of variables used in the study
This table presents the basic descriptive statistics for the main variables in the study for the period 2003–2017. INC is a variable representing the firm’s inclusion in the Dow Jones Sustainability World Index and is 1 if the firm is in the DSJWI and 0 otherwise. EDITO is a variable representing editorial content within the meaning of Carroll. SIZE represents company size measured by the logarithm of total assets. ROA is the return on assets measured by the ratio between pre-tax profits, taxes and interest and the total assets. LEV is the company’s debt measured by the total liabilities divided by total assets. FCF is the ratio between free cash-flow and total sales. MTB is the market-to-book ratio measured by the ratio between the stock-market value and the book value of company equity. The variable CEO is a binary variable that takes the value 1 if the editorial is signed by the CEO and 0 otherwise. SD is a binary variable that is 1 if the editorial is published in a sustainable development report and 0 otherwise. The FOG variable is a readability index of editorials in CSR reports used in our study.
Table 3
Correlation matrix
This table shows the Pearson correlation coefficients between the variable INC and the explanatory variables for the period 2003–2017. INC is a variable representing the firm’s inclusion in the Dow Jones Sustainability World Index and is 1 if the firm is in the DSJWI and 0 otherwise. EDITO is a variable representing editorial content within the meaning of Carroll. SIZE represents company size measured by the logarithm of total assets. ROA is the return on assets measured by the ratio between pre-tax profits, taxes and interest and the total assets. LEV is the company’s debt measured by the total liabilities divided by total assets. FCF is the ratio between free cash-flow and total sales. MTB is the market-to-book ratio measured by the ratio between the stock-market value and the book value of company equity. ***, **, and * indicate the 1%, 5%, and 10% significance levels, respectively.
Table 4
Results of the fixed-effects logit model regression for panel data
This table presents the result of estimation of the fixed-effects logit model regression for panel data (years and sectors) using as the only explanatory variable editorial content within the meaning of Carroll in CSR reports (Model 1). The dependent variable takes the value 1 if the firm is included in the Dow Jones Sustainability World Index and 0 otherwise. k is the selected forecast horizon. Type A is the percentage of inclusions of firms in the DJSWI without any signal being emitted. Type B is the percentage of false alerts among all the signals. ***, **, and * are the 1%, 5%, and 10% significance levels, respectively.
Table 5
Results of the regression for panel data with fixed effects in the presence of control variables and the moderator variables
This table presents the result of estimation of the fixed-effects logit model regression for panel data (years and sectors). Model 2 includes the control variables only whereas model 3 includes both the control variables and the variable of editorial content within the meaning of Carroll in CSR activity reports. Model 4 incudes a variable for EDITO × CEO interaction. Model 5 is used to test the moderating role of the type of editorial. Models 6 and 7 are used to test the moderating role of editorial readability. The dependent variable (INC) takes the value 1 if the firm is included in the Dow Jones Sustainability World Index and 0 otherwise. The variable CEO is a binary variable that is 1 if the editorial is signed by the CEO and 0 otherwise. SD is a binary value that is 1 if the editorial used is published in a sustainable development report and 0 otherwise. FOG is the readability index of the report editorials used in our study. IND is a dummy variable that captures the sector activity effects. YEAR is a dummy variable that captures time effects. Type A is the percentage of inclusions of firms in the DJSWI without any signal being emitted. Type B is the percentage of false alerts among all the signals. ***, **, and * are the 1%, 5%, and 10% significance levels, respectively.