
Abstracts
Abstract
During the first wave of COVID‑19, the uncertainty about a prospect vaccine combined with the constant media bombardment have fueled the fear of strict periods of confinement measures, creating a fertile ground for fake news and misleading social media debates. This paper studies how the public attention to certain pandemic-related topics and the social media activity of health and policymaker influencers impact the energy sector. Our findings suggest that during periods of growing attention to the term “Coronavirus”, social media activity of policymaker influencers exhibits a negative relationship with the energy sector. However, given the positive and scientific connotation, when the public attention to the term “Vaccine” increases, we observe a positive impact of international health organizations.
Keywords:
- ICT,
- Social media,
- COVID‑19,
- Public attention,
- Energy industry
Résumé
Au cours de la première vague de COVID‑19, l’incertitude sur le développement d’un éventuel vaccin et le bombardement médiatique constant ont alimenté la peur de la mise en oeuvre de strictes politiques de confinement, créant un terrain fertile pour de fausses informations et les débats trompeurs dans les réseaux sociaux. Nous étudions dans cet article comment l’attention du public à certains problèmes liés à la pandémie et l’activité sur les réseaux sociaux des agences de santé publique et des décideurs politiques impactent le secteur de l’énergie. Les résultats obtenus suggèrent qu’en période d’attention croissante au terme « Coronavirus », l’activité sur les réseaux sociaux des responsables politiques présente une relation négative avec le secteur de l’énergie. Cependant, étant donné la connotation positive et scientifique, lorsque l’attention du public sur le terme « Vaccine » augmente, nous constatons un impact positif organisations internationales de santé.
Mots-clés :
- technologies de l’information et de la communication (TIC),
- Réseaux sociaux,
- COVID‑19,
- Attention du public,
- Industrie de l’énergie
Resumen
Durante la primera ola de COVID‑19, la incertidumbre sobre el desarrollo de una posible vacuna y el constante bombardeo mediático, han alimentado el temor a la implementación de estrictas políticas de confinamiento, creando un terreno fértil para noticias falsas y debates engañosos en redes sociales. En este artículo estudiamos cómo la atención pública a ciertos temas relacionados con la pandemia y la actividad en las redes sociales de organismos de salud publica y responsables políticos impactan en el sector energético. Los resultados obtenidos sugieren que durante períodos de creciente atención al término “Coronavirus”, la actividad en las redes sociales de responsables políticos presenta una relación negativa con el sector energético. Sin embargo, dada la connotación positiva y científica, cuando aumenta la atención pública hacia el término “yaccin”, observamos un impacto positivo de organismos internacionales de salud.
Palabras clave:
- Tecnologías de la información y las comunicaciones (TIC),
- Redes sociales,
- COVID‑19,
- Atención pública,
- Industria de la energía
Article body
The COVID‑19 outbreak has triggered the worst health crisis since the 1918 flu pandemic and exposed the vulnerability of the health system infrastructure in most developed countries. Without a prospect vaccine nor an efficient and successful treatment, most governments opted to implement confinement measures to disrupt the contagion rate and flatten the cases curve. Although the repercussions vary across countries, social distancing measures and non-essential business lockdown have dramatically affected the global economy and polarized the public opinion. On the one hand, confinement and social isolation measures have altered our daily habits and social behavior, turning much of our professional and social interactions online and, in consequence, boosting the use of social media platforms. On the other hand, lockdown measures imposed by governments all over the globe dramatically reduced the economic activity and increased market uncertainty, triggering an unprecedented decline in the global energy demand. The global turmoil combined with the dramatic decrease in the energy demand and the fear of a deep and long term economic recession led the energy sector, more precisely the fossil fuel industry, at the eye of the storm. The loud collapse of the industry during the first wave of COVID‑19, and the consequent reduction of emissions have opened the post-coronavirus energy transition debate and promoted the social media discussion with prominent public figures and policymakers taking sides. Given the strategic role and the potential impact on a future sustainable policy architecture, we study how the public attention to certain pandemic-related topics and the social media activity of health and policymaker influencers impact the energy sector during the COVID‑19 outbreak.
Following the International Energy Agency (IEA) monthly oil report release, the executive director, Fatih Birol, said “In a few years’ time, when we look back on 2020, we may well see that it was the worst year in the history of global oil markets”. It might sound a bit apocalyptic, however, Birol has voiced a generalized belief among policymakers and market experts. At that time, according to the IEA Oil Market Report (April 2020), the global oil demand was expected to fall by a record 9.3 million barrels a day (mb/d) year-on-year in 2020, while the oil demand in April was estimated to drop 29 mb/d compared with the same month last year, the lowest level seen in the last 25 years. Although the extent and ramifications of the economic situation are rather complex, the pandemic has triggered a severe demand/supply dualshock causing the collapse in the oil and gas demand and the overproduction of a commodity reaching the full storage capacity. To knock it out even harder, the Russia-Saudi Arabia oil price war has pulled energy prices to unprecedented levels exacerbating the devastating impact on the energy sector. Dragged by the high cost of stopping and restarting production and the storage capacity at the maximum level, on April 20, the oil market traded at a negative price for the first time in recorded history, when the West Texas Intermediate (WTI) crude hit $-36.20 per barrel, triggering a media bombardment—both reliable and fake news—and pointing the public attention and social media debate toward the energy market. More recently, mostly due to the OPEC+ agreement to ease record oil supply curbs and the end of the Saudi Arabia voluntary 1 mb/d cut —see, IEA Oil Market Report (August 2020) and IEA Oil Market Report (September 2020)— the global oil supply rose by 2.5 mb/d and 1.1 mb/d in July and August, respectively. Despite the recovery signs, the subsequent COVID‑19 waves and the steeped upsurge of new cases in many countries led to the reinforcement of social distancing measures and restrictions such as banning gatherings and the compulsory mask-wearing policy, while some countries implemented a localized lockdown policy to fight subsequent waves of the virus.
In this paper we aim to study the relationship between the public attention to certain pandemic-related topics and the social media activity of health and policymaker influencers and the energy sector during the first wave of the COVID‑19 outbreak. First, we gauge the public attention to certain pandemic-related trending topics using Google Trends. In order to cover different dimensions of the pandemic we analyze the search query popularity of “Coronavirus”, “COVID‑19”, “Lockdown”, “Vaccine”, and “Immunization”. Secondly, we analyze the social media activity on Twitter of health and policymarker influencers, more precisely, the Centers for Disease Control and Prevention (CDC), the World Health Organization (WHO), and D. Trump. We aim to capture the impact of highly relevant social media content with the potential to spread across a large audience and to influence people’s opinion and behavior, hence we opt to measure the impact of Retweets and Likes. We contribute to the extant literature fourfold, i) We study how the public attention affects the energy sector, and we find that the public attention toward “Coronavirus” exhibits a negative and significant relationship with the energy market and during periods of growing economic policy uncertainty the negative effect is intensified; ii) we study the impact of prominent public figures and institutions during the COVID‑19 outbreak, our findings suggest that the social media activity of the CDC played an instrumental role during the outbreak and the impact is deepen with higher level of uncertainty; iii) we combine the public attention and social media activity to identify periods and prominent public figures and institutions of high influence, we find that given the positive and scientific connotation, when the public attention to the term “Vaccine” increases, health influencers positively impact the energy sector. On the other hand, when the public attention toward “Coronavirus” increases the social media activity of D. Trump becomes particularly relevant and negative; iv) since oil prices shocks have a large and significant impact on economic volatility, applying a structural VAR approach, we decompose the observed variance and analyze the relative contribution of the public attention variability and shocks in explaining the energy sector dynamics, we find that shocks in the public attention not only represent major contributors to the energy sector dynamic but also the impact tends to increase over time suggesting a persistent effect.
The results obtained in our study shed some light on how the public attention and social media dynamics impact the energy sector during the COVID‑19 pandemic and might be used to develop an effective and efficient policy strategy. With the fossil fuel industry immersed in the worst energy crisis in recorded history, the COVID‑19 pandemic poses an opportunity to promote and develop a sustainable energy transition and design a long-term policy architecture. As Fatih Birol tweeted on March 24, 2020 “Today, governments are managing the medical crisis caused by COVID‑19 & quickly building financial firewalls. When they launch stimulus plans to drive the economic recovery, they’ll have a big chance to boost clean energy transitions as well”.
Energy industry, social media, misinformation and politicization
COVID‑19 and the energy industry. The COVID‑19 pandemic has caused a worldwide economic and social disruption. Particularly during the first wave of COVID‑19, the epidemiological and sanitary uncertainty led governments all over the globe to imposed confinement and lockdown measures to contain the spread of the virus, deteriorating the economic activity and, consequently, reducing the global energy demand. Since the beginning of the pandemic, a considerable amount of literature has studied the COVID‑19 pandemic transmission mechanisms to the energy industry and its long- and short-term impact. Claiming that no national energy market is unscathed, Szczygielski et al. (2021) finds that the negative impact is associated with higher levels of volatility and concluded that COVID‑19 uncertainty is part of the composite set of factors driving the energy sector returns. Sharif et al. (2020) finds that, during the first months of the pandemic, there is an unprecedented volatility jump in the US geopolitical risk caused by the COVID‑19 outbreak and the consequent increase in oil price volatility. Focusing on energy stock indexes, energy futures, ETFs, and implied volatility indexes, Shaikh (2022) finds that the dwindling demand caused by the lockdown and the decreased fuel consumption, combined with the provisional upsurge in supply led to higher levels in the energy market volatility. On a different dimension of analysis, Fu and Shen (2020) finds that, during the first quarter of 2020, the pandemic severely hit productivity in the energy sector and most companies struggled to cover fixed costs and expenses causing a negative impact on the corporate performance of the energy industry. Furthermore, according to Crider (2020), as of August 5, 2020, citing the COVID‑19 pandemic as the cause, a total of 19 energy companies have filed for bankruptcy in the US.
Undoubtedly, the COVID‑19 has severely affect the energy industry, however, there is an asymmetric impact between the fossil fuel and the renewable energy industry. Analyzing the impact on energy production in 30 Chinese provinces, Chen et al. (2021) concludes that the pandemic has negatively influenced the energy production and the impact is more pronounced on traditional energy (ie, oil, coke, kerosene, gasoline, fuel oil, and raw coal) than on renewable energy production, while studying the impact on energy generation in Europe, Werth et al. (2021) finds that generation from nuclear, fossil coal and gas sources was reduced while intermittent renewables generation increased in most countries.
Confinement and lockdown measures have drastically altered our daily lives and habits. Mastropietro et al. (2020) claims that confinement measures and lockdowns increase residential energy demand due to higher occupancy, reducing family income and fostering energy poverty. Moreover, Rouleau and Gosselin (2021) studies changes in energy consumption under lockdown and confinement and the impact on the energy bill for consumers. The authors find a significant change in the consumption pattern, instead of concentrating energy consumption in the evening, during the lockdown energy consumption is spread throughout the day.
Social media and public attention. A large number of studies in the broader literature have examined the impact of social media and public attention. Under the climate change framework, Loureiro and Allo (2020) uses tweets to compare the preferences and sentiments toward climate change in Spain and UK, while using daily volume of tweets containing the term “climate change” and “global warming” to measure the public interest, Kirilenko et al. (2015) finds that not only weather anomalies but also mass media coverage control the public attention to climate change. Taking Twitter as a channel of communication between government agencies involved in disaster management and the public, Platania et al. (2022) studies the impact of social media during periods of emergency. The authors find that social media activity triggers public concerns about potential shortages, influencing the price of agricultural commodities. Closely related to the energy sector, Russel et al. (2011) implements data mining and content analysis techniques to analyze energy-related social media conversations taking place in twitter and finds that studying large scale twitter conversations not only can help to identify influencers but also can potentially be used to track the public opinion and behavioral patterns related to sustainability and energy consumption. Also using content analysis techniques, Bollen et al. (2011) categorizes in positive and negative mood the content of daily Twitter feeds and finds statistically significant correlation to daily changes in the Dow Jones Industrial Average. Starting right after the terrorist attacks of 9/11, Reuter and Kaufhold (2018) provides a 15 years summary about the use of information and communication technology (ICT) and social media in emergencies, suggesting that social media use substantially grows during emergency and crisis events, while using rumor theory and focusing on three different social crises, Oh et al. (2013) studies citizen-driven information processing through Twitter. On a different strand of literature, using Google search volume index, Guo and Ji (2013) analyzes the relationship between oil prices and market concerns. Following a similar approach to calibrate the public attention, Han et al. (2017) empirically tests the forecasting power of the investor attention onto oil prices finding statistically significant results at the daily and weekly horizon, while Li et al (2014) confirms the forecasting ability of the public attention measured by Google search volume interest.
COVID‑19, fake news and social media. The lack of knowledge about the epidemiological and clinical aspects of the disease and the growing uncertainty during the first wave of COVID‑19 have dominated the global scene and propitiated a fertile ground for fake news and conspiracy theories, triggering public attention shocks and fostering intense social media debates. Although making reference to the Zika virus, Dredze et al. (2016) finds that uncertainty regarding the origin, transmission and health consequences of the virus promote the use of social media platforms to spread and disseminate pseudo-scientific claims. More recently, Tasnim et al. (2020) finds that the spread of misinformation and the exposure to high-volume of information during the COVID‑19 pandemic can cause relaxation of healthy behaviors and promote erroneous practices. In line with our analysis, Brennen et al. (2020) analyzes the role of prominent public figures—influencers—in spreading misinformation about COVID‑19 and finds that, although it represents a small portion of the total, misinformation claims from prominent public figures often have very high levels of engagement. This is particularly concerning because even though the presence of a fake news might be detected and flagged, Moravec et al. (2019) finds that a fake news flag has no effect on judgments about the truth.
As presented above, on the one hand, the academic literature has intensively studied the relationship and different transmission mechanisms between the COVID‑19 pandemic and the energy industry. On the other hand, even before the pandemic, a considerable amount of literature analyzed the impact of social media and the public attention on the energy market. However, to the best of our knowledge, no previous study has investigated how the public attention and social media activity of relevant public figures and agencies affect the energy industry during the COVID‑19 pandemic. Hence, in this study, we aim to test the following hypotheses:
Hypothesis 1.a (Public attention): The public attention toward the COVID‑19 pandemic has a significant impact on the energy industry.
Hypothesis 1.b (Public attention): Economic policy uncertainty intensifies the impact of the public attention.
Hypothesis 2 (Influencers): Highly influential social media content of health agencies and policymakers has a significant impact on the energy industry during the COVID‑19 outbreak.
COVID‑19 politicization. Sadly, the worst health crisis in modern history has transcended the epidemiological dimension and became a political weapon. Particularly worrying, the COVID‑19 pandemic has been intensively used as a political instrument during the 2020 US presidential election campaign, where the spread of misinformation and the unconditional defense of a political color have immensely contributed to polarize the public opinion and segregate the population in two groups, those in-favor or against the confinement measures. Since social media users tend to believe and validate the information that best align with their own political opinion—Moravec et al. (2019) and Kim and Dennis (2019)—, global leaders and policymakers play an instrumental role and heavily influence the public opinion. Even long before the outbreak, the energy industry has been heavily politicized and polarized between climate change “believers” and “deniers”, the growing impact of digital activism—George and Leidner (2019)—, the COVID‑19 crisis and the influence of prominent public figures helped to magnify the discrepancies. On a rather concerning aspect of the ICT, Mora et al. (2020) analyzes 2187 COVID‑19 related documents and measures the effectiveness of the technological solutions adopted to control the outbreak. The authors find that, often by screening and controlling the traffic of information, ICTs become a political instrument allowing public authorities to reinforce their power.
Considering the political context and the role of health agencies and policymakers to influence the public opinion, we aim to study how the public attention moderate the impact of social media and we propose to test the following hypothesis:
Hypothesis 3 (Interaction effect): The public attention has a moderating effect on the impact of social media.
Methodology and data set
According to the WHO’s situation report 1, on December 31, 2019, the WHO China Country Office was first informed of some cases of unknown causal agent pneumonia detected in Whuhan City. Up to January 3, 2020, the national authorities in China reported a total of 44 patients with pneumonia of unknown etiology. Although between January 11 and 12, 2020, the National Health Commission in China associated the outbreak with exposures in one seafood market in Wuhan City, the Chinese authorities were able to isolate and identified a novel type of coronavirus on January 7, 2020. Hence, we take the novel coronavirus-type identification date as starting point and we collect data from January 7, 2020. The first coronavirus wave was surrounded by a great deal of uncertainty not only from the epidemiological and sanitary side but also from the political and economic perspective including the US presidential campaign. The global turmoil combined with confinement measures during the first wave created a fertile ground to fake news and an intensive social media debate. Hence, we analyze the first wave of coronavirus and we collect data up to September 25, 2020. The data used in our analysis are obtained from different source.
Energy sector
The data set used for the analysis consists of daily observations of closing prices obtained from Compustat. We look at the Global Industry Classification Standard (GICS) taxonomy and consider all the sub-industries within the Energy sector including Integrated Oil & Gas, Oil & Gas Exploration & Production, Oil & Gas Refining & Marketing, Oil & Gas Storage & Transportation, Coal & Consumable Fuels, Oil & Gas Drilling and Oil & Gas Equipment & Services. We exclude from the data set those companies with no reported closing price or trading volume, leaving us with 353 listed companies.
COVID‑19 cases and deaths
We collect from the WHO webpage the cumulative number of US confirmed cases and deaths. Note that, according to the WHO database, the first confirmed coronavirus related case-patient in the US was reported on January 20, 2020, while the first death was reported on March 3, 2020. Figure 1 upper-left and -right corner present the evolution of cumulative confirmed cases and the evolution in logarithm scale, respectively, while figure 1 lower-left and -right corner present the death toll evolution and the logarithm scale, respectively.
Figure 1
Cumulative confirmed Cases and Deaths in the US up to September 25, 2020

Economic policy uncertainty
Uncertainty plays an instrumental role during crises and economic downturns, in particular uncertainty regarding fiscal, monetary, or regulatory policy, which refers to economic policy uncertainty (EPU), see Baker et al. (2016). Given the scope and magnitude of the COVID‑19 outbreak, governments all over the world implemented different social distancing policies ranging from sanitary recommendations to strict quarantines and non-essential services lockdown affecting the economic policy uncertainty. Thus, we collect daily observations of the US news-based Economic Policy Uncertainty Index.[1] Figure 2 shows the EPU index evolution in the US, we observe a sharp increase since mid-March following the declaration of a pandemic by the WHO on March 11, 2020.
Figure 2
Economic Policy Uncertainty in the US from Janyary 7, 2020 up to September 25, 2020

Search volume interest
We rely on Google Trends to measure the evolution in popularity of certain keywords. Google Trends reports the historical search volume interest (SVI) and search trends collected by Google’s search engines and it analyzes the popularity of top search queries. In order to cover different dimensions of the pandemic we analyze the search query popularity of “Coronavirus”, “COVID‑19”, “Lockdown”, “Vaccine”, and “Immunization” from January 7, 2020 up to September 25, 2020. Figure 3 shows the SVI of these five keywords and table 1 panel-Google presents descriptive statistics.
Table 1
Descriptive statistics

Figure 3
Google search volume interest evolution from Janyary 7, 2020 up to September 25, 2020

Figure 3 upper-left and -right corner show the trend evolution of “Coronavirus” and “COVID‑19”, respectively. Although many people use both term as synonyms, the term “Coronavirus” makes reference to Coronaviruses (CoVs) which belong to a particular genera within in the Coronaviridae and are the largest group of viruses belonging to the Nidovirales order, see for instance Holmes (1999). Hence, the term “Coronavirus”, although fairly popular among the general population, does not identify the particular strain of coronavirus causing the global pandemic. The term “COVID‑19”, on the other hand, makes reference exclusively to the SARS-CoV-2 and identifies precisely the coronavirus strain causing the outbreak. During the first part of the sample, when the virus was mainly contained within the Chinese and European borders and just a few cases were reported in the US, we observe a rather low popularity level for the “Coronavirus” search query and mostly no activity for “COVID‑19”. As stated above, according to the WHO database, the first confirmed coronavirus related case-patient in the US was reported on January 20 and the first death was reported on March 3 while the outbreak was declared a pandemic on March 11, 2020. Therefore, the SVI on both terms increases significantly on March, when both confirmed cases and deaths grew substantially, reaching the maximum level (100) on March 15 and 23 for “Coronavirus” and “COVID‑19”, respectively.
Figure 3 middle-left and lower-left show the trend evolution of “Vaccine” and “Lockdown”, respectively. Hardly surprising, both terms popularity increases significantly right after the pandemic declaration and we can identify several period of peaking popularity. On the other hand, figure 3 middle-right presents the SVI evolution of the term “Immunization”, the first eye-catching characteristic is the oscillating behavior during the whole sample while it is particularly interesting the SVI upgrowth since July combined with the popularity peak reached on August 11.
Influencers
Although the rather recent use of the term influencer, historically speaking an influencer can be defined as an individual or group with the ability to influence the behavior of others. In general, an influencer possess a combination of charisma, authority, expertise, and credibility that allows them to effectively impact their audience’s decision making process. The use of microblogging and social networking platforms—such as Twitter, Facebook, or Instagram, among others—as a channel of communication with their objective audience is a distinctive characteristic of modern influencers. In these virtual communities, influencers represent a small portion but they are responsible for most of the content and discussion—see Martinez Torres et al. (2015). During the last decades, social media has gained a great deal of popularity and, as shown in Perrin (2015), a growing number of users turn to these platforms as a primary source of news and information. Unlike traditional media channels, social media is highly interactive, allowing users to exchange ideas, information, theories, and news, reaching a broader audience and forming people’s opinion and perception. Social media influencers play a critical role during the COVID‑19 pandemic. On the one hand, health influencers informing about the state of the pandemic, advances on treatments, or simply issuing health and sanitary recommendations, might influence people’s behavior and the public perception regarding the implementation of further restrictions. People’s expectations, particularly if they are referred to confinement measures and lockdowns, directly impact the economic activity and, in consequence, energy markets. On the other hand, social media has been an instrumental vehicle for policymakers. In particular, D. Trump has intensively used Twitter to inform about the implementation of policies and regulations regarding the COVID‑19 pandemic, and also to campaign for the 2020 presidential election. Among the vast pool of social media platforms, Twitter has gained a great deal of popularity. Hence, we take Twitter as the main communication channel and we analyze the social media activity of three main actors during the coronavirus outbreak:
-
Centers for Disease Control and Prevention (CDC): under the Department of Health and Human Services, the CDC is the leading health institute in the US. Founded in 1946, the CDC is a federal agency with its headquarter located in Atlanta, Georgia. The use of social media is part of the CDC communication strategy, and it is particularly active in Twitter thru its many and specialized profiles. We collect tweets posted in the official CDC’s Twitter account, @CDCgov. Figure 4 presents the Twitter metrics and table 1 panel-CDC presents descriptive statistics.
Figure 4
Centers for Disease Control and Prevention Twitter activity from Janyary 7, 2020 up to September 25, 2020

-
World Health Organization (WHO): within the United Nations system, the WHO is the directing and coordinating authority on international health. Founded in 1948, the WHO is an international organization with its headquarter located in Geneva, Switzerland. The WHO is active on several social media channels, we collect tweets posted in the official WHO’s Twitter account, @WHO. Figure 5 presents the Twitter metrics and table 1 panel-WHO presents descriptive statistics.
Figure 5
World Health Organization Twitter activity from Janyary 7, 2020 up to September 25, 2020

-
Donald Trump: Born in 1946, Donald John Trump was elected the 45th president of the United States on November 8, 2016. Trump presidency has not been exempted from controversy, he has been frequently accused of racism, sexual misconduct, and making false statements. During the 2020 US presidential campaign, Trump has politicized the pandemic and has been accused of spreading misinformation and misleading the public opinion. His particular view on climate change has attracted the public attention worldwide and raised criticism within the scientific community. Trump has rejected multiple times the scientific consensus on climate change and has questioned the veracity of the human-caused climate change. Pledging for energy independence, Trump withdrew the US from the Paris Agreement on climate change, promoted the extraction and production of fossil fuels and relaxed federal regulations on greenhouse gas emissions. Ever since Trump has joined Twitter, in 2009, he has been actively using Twitter, we collect tweets posted in Trump’s account, @realDonaldTrump. Figure 6 presents the Twitter metrics and table 1 panel-D.Trump presents descriptive statistics.
Figure 6
Donald Trump Twitter activity from Janyary 7, 2020 up to September 25, 2020

Analysis and Results
The aim of this section is to analyze the impact of different dimensions of public attention on the Energy sector, we measure the public attention as i) the SVI to certain trending topics related to the pandemic, and ii) the health and policymaker influencers’ social media activity as presented in the previous section.
The Energy sector dynamic is nothing but a system of a large number of interrelated individual variables interacting among each other. The full data set includes 7 sub-industries within the energy sector, that is 353 individual companies. Although we focus the attention on one particular sector, the data set includes a rather large and heterogeneous sample. The high dimensional order of the system embeds a great deal of noisy components and idiosyncratic variations which are endemic to each individual company and might prevent us from identifying the key drivers in the sector or unveil the public attention systemic impact. In order to reduce the dimensionality and retain the systemic variation specific to the energy sector, we apply a principal component analysis (PCA). The idea behind the PCA analysis is to transform the variables into a new set of uncorrelated variables—the principal components—ordered by variance score, where the first component accounts for the largest possible variance in the original data set and the first few components retain most of the variation observed in the original data set.
Consider that the energy sector is defined by the t × p matrix, X, with known covariance matrix, ∑, where each of the p-columns represents an individual company and each of the t-rows represents the observed logarithmic return at a given time. The principal components are defined by an orthogonal linear transformation of X,
where Φ is an orthogonal matrix whose k-th column corresponds to the t-th eigenvector of ∑, and k = 1,2,...,p. The first principal component, Z1, corresponds to the normalized linear combination that inherits the maximum possible variance from the original data set and captures most of the systemic variation. Considering the 353 companies included in the Energy sector, the first component, Z1, accounts for 41.72% of the total variation in the original data set and constitutes a benchmark for the systemic variation in the energy sector.
Trending topics
We start analyzing the relationship between daily increments of the selected keywords SVI and daily log-returns in the energy sector, that is, Z1. Table 2 presents different regression models, in all of them we control for the effect of the number of confirmed cases, deaths and economic policy uncertainty. The results remain stable and robust across models and we observe a negative impact of the number of confirmed cases and no significant results for the EPU and death count. Although the number of confirmed cases has not been exempted from controversy, official counts of COVID‑19 related deaths have been under the spotlight and continuously challenged. Different states have different rules and regulations to code and report a COVID‑19 related death. Even though the CDC has issued a COVID‑19 coding and reporting guideline, a technical note within the Death Data and Resources section warns that “[The CDC report] includes deaths where COVID 19 is listed as a ‘presumed’ or ‘probable’ cause. Some local and state health departments only report laboratory-confirmed COVID 19 deaths” and prevents from comparing official figures across states arguing that “Death counts should not be compared across states. Data timeliness varies by state. Some states report deaths on a daily basis, while other states report deaths weekly or monthly”.
Table 2, model (1) and (2) present a simple linear regression between log-returns and the SVI to “COVID‑19” and “Coronavirus”, respectively. Even though, both models exhibit negative and statistically highly significant () estimates, the systemic variation explained by the term “Coronavirus” is appreciably higher, suggesting a closer relationship with the energy sector, with a R2 of 19.9%. Although the term coronavirus does not identify the particular strain of the virus causing the global pandemic, it is fairly popular among the general population and tracks the general interest toward the virus. Model (3) includes the interaction effect between the term “Coronavirus” and the EPU index. Interestingly, we observe that when the economic policy uncertainty increases the search interest toward “Coronavirus” has a stronger negative effect on the energy sector. This result is especially relevant as it help us to understand and identify those periods when the public attention is particularly sensitive and policy announcements might have a deeper impact.
Model (4) and (5) present the relationship between the SVI to “Lockdown” and the energy sector. The implementation of different social distancing measures and non-essential business lockdown have dominated the social media debate and heavily influenced the public opinion. As expected, we observe a highly significant and negative relationship between the SVI to “Lockdown” and the energy sector. An increase of the public attention toward the term “Lockdown” depicts a growing concern among the general population producing a negative impact in the energy sector.
Model (6)-(7) and (8)-(9) present the relationship between the SVI to “Vaccine” and “Immunization”, respectively. We observe that the public interest toward these terms does not have a significant impact on the energy sector. However, model (9) shows that when there is a growing interest toward “Coronavirus” the term “Immunization” has a highly significant and positive impact on the energy sector, however, it is worth to mention that since the very first phase of the outbreak there has been an intense debate around the herd immunity, while more recently, there has been a growing uncertainty and debate about the longevity of the antibody response and immunity to SARS-CoV-2. On a media statement released on August 14, the CDC reported that “...this science does not imply a person is immune to reinfection with SARS-CoV-2, the virus that causes COVID‑19, in the 3 months following infection”, meaning that there is no evidence of immunity to coronavirus after having been infected once. Interestingly, after being cleared to resume public activities, on October 11 D.Trump tweeted “A total and complete sign off from White House Doctors yesterday. That means I can’t get it (immune), and can’t give it. Very nice to know!!!”. This tweet generated a strong reaction and controversy, media all over the globe accused Trump of misleading the public and downplaying the virus while Twitter added a warning label saying “This Tweet violated the Twitter Rules about spreading misleading and potentially harmful information related to COVID‑19”. Mejia and Ramaprasad (2020) analyze the race and gender biases in the provision of fact-checking information and conclude saying “A false evaluation of a Kamala Harris statement will likely impact her competence, whereas a false evaluation of Donald Trump is becoming increasingly pointless”. Considering his flagged tweet record, we cannot help but wonder if and under which circumstances the social media activity of president D. Trump is relevant—which motivates the following section.
Finally model (10) presents the full model version with all the explanatory variables. Although the collinearity among predictors prevent us from interpreting the estimated coefficients, it does not reduce the predictive power or reliability of the model. It is interesting to observe that 36.1% of the systemic variability observed in the energy sector during the COVID‑19 outbreak is explained by this model.
Influencers
In this section we study a different dimension of public attention. We gauge the public attention as the social media activity of influencers within the health and policymaker community, more precisely, the CDC, WHO and D. Trump.
Retweets and Likes can be regarded as mechanisms to propagate and validate a message. According to Twitter “[Likes] are used to show appreciation for a Tweet”, thus, when a user Likes a tweet is somehow agreeing or validating the message. On the other hand, retweeting is the action to repost or forward a message tweeted by another user. Cha et al. (2010) defines retweet influence as the ability to generate content with pass-along value and reach an audience beyond the own network. In this line, Boyd et al. (2010) analyzes the incentives to retweet and finds that, among the top ten motivations, users retweet to amplify and spread a message to new audiences and also to publicly agree with someone; while Geva et al. (2019) finds that users tend to retweet mostly about topics consistent with the content they produce themselves, suggesting certain level of familiarity with the topic they retweet. Hence, when analyzing the relationship with the energy sector, Retweets and Likes should display the same directionality. However, given the power to propagate the message and reach new audiences, we might expect a stronger impact from Retweets.
Table 2
This table presents estimates of different regression models explaining the relationship between the energy sector and the public attention to “COVID‑19”, “Coronavirus”, “Lockdown”, “Vaccine”, and “Immunization” from January 7, 2020 up to September 25, 2020

Standard errors in parentheses.
* p<0.1, ** p<0.05, *** p<0.01
Table 3-model (1) and (2) present the regression models using the CDC retweets as predictor. In both models, we observe a negative and robust impact on the energy sector. Despite the scandal generated by the defective test kits distributed by the agency in early February and the media’s criticism, our findings suggest that, as the leading public-health agency in the US and global health influencer, the CDC plays an influential role during the coronavirus health crisis. CDC’s messages are widely disseminated among the general public and have a significant impact on the energy sector. Moreover, model (2) suggests that during periods of growing economic policy uncertainty the social media activity of the CDC has a more pronounced impact on the energy sector, with a highly significant and negative interaction effect between the CDC-RT and the EPU. This result is particularly interesting since identifying periods of high influence can help to design an effective communication policy.
Table 3-model (3) and (4) describe the relationship between WHO’s social media activity and the energy sector. These results indicate a sparse impact of the WHO’s social media activity on the sector that might be strongly linked to the public image deterioration and falloff in credibility caused by a series of accusation, in particular, from president Trump’s office. Indeed, throughout the COVID‑19 outbreak, president Donald Trump has publicly accused the WHO of mismanaging and helping to cover up the spread of the virus and of being very China centric. For example, a notorious and controversial tweet on April 7, 2020, said “The W.H.O. really blew it. For some reason, funded largely by the United States, yet very China centric. We will be giving that a good look. Fortunately I rejected their advice on keeping our borders open to China early on. Why did they give us such a faulty recommendation?”. Moreover, closely related to a declaration made on January 14, 2020, when the WHO tweeted “Preliminary investigations conducted by the Chinese authorities have found no clear evidence of human-to-human transmission of the novel #coronavirus (2019-nCoV) identified in #Wuhan, #China”, president Trump claimed that “Through the middle of January, [the WHO] parroted and publicly endorsed the idea that there was not human to human transmission happening, despite reports and clear evidence to the contrary”. Although on January 22, 2020, the WHO rectified and tweeted “There is evidence of person-to-person transmission among close contacts such as in families or in health care settings. This is not unexpected with a respiratory disease. We have not seen any evidence of onward transmission such as 3rd, 4th generation transmission”, the politicized use of certain tweets and statements jeopardized WHO’s credibility and biased the public perception.
Table 3-model (5) and (6) show the relationship with Donald Trump’s twitter activity. It is worth to mention that President Trump uses twitter intensively to inform—official and non official matters—and express his opinion on a large variety of topics, most of them orthogonal to the COVID‑19. For example, during the COVID‑19 outbreak, among his most popular tweets we find a condolence tweet for the death of Kobe Bryant on January 27, 2020, or a tweet informing of a missile attack at two military bases located in Iraq on January 8, 2020. Thus, given the large and heterogeneous range of topics covered by @ realDonaldTrump we do not observe a significant effect on the energy sector.
Finally, table 3-model (7) presents the full model with all the predictors. Although collinearity among predictors prevent us from interpreting the estimated coefficients, the public attention, measured as the social media activity of influencers within the health and policymaker community, explains 17.9% of the systemic variability observed in the energy sector during the COVID‑19 outbreak.
Table 4-model (1) to (7) present the regression models considering the Likes metric instead of Retweets. The results confirm that Likes and Retweets display the same directionality, both estimates and significance level remain quite similar for both metrics. Moreover, as predicted, given the power to propagate the message and reach new audiences, Retweets exhibit a higher explanatory power.
Public attention interaction
In this section we aim to study the two-way interaction effect between both dimensions of the public attention, that is, trending topics SVI and Influencers social media activity. Table 5 takes the SVI toward the terms “Coronavirus” and “Lockdown” and presents a set of regression models interacting these terms with the influencers’ social media activity, while table 6 provides a similar analysis considering the SVI toward the terms “Vaccine” and “Immunization”.
First, table 5 shows that, despite interacting the SVI with different predictors, the individual effect of the SVI to both “Coronavirus” and “Lockdown” remain highly significant and negative in every case, evidencing a quite stable and robust effect on the energy sector. On one hand, table 5-model (5) suggests that, when the public attention to “Coronavirus” increases, D. Trump’s social media activity greatly impact the energy sector. Interestingly, given the wide range of topics discussed via twitter, in the previous section we have not observed a significant impact of Trump twitter activity. However, the two-way interaction model suggests that, when the public attention to “Coronavirus” increases, the impact of Trump social media activity becomes relevant. We might expect two complementary effects inducing these results, when the SVI to “Coronavirus” increases i) Trump narrows down the social media discussion and focuses the narrative to pandemic-related topics with stronger policy implications, and ii) Trump tweets propagate faster and experience a deeper repercussion in the energy sector. In any case, model (5) explains a great deal of the systemic variation in the energy sector during the outbreak with a coefficient of determination of 24.4% while the full model, that is model (7), explains 37.0% of the systemic variation.
Table 6-model (1) and (3) present the interaction effect between the term “Immunization” and the social media activity of the CDC and WHO, respectively. Given the growing uncertainty and the constant bombardment of information about the longevity of the antibody response and immunity to SARS-CoV-2, the term “Immunization” has been perceived in a negative connotation, for example, the Coronavirus update 34 reported by the WHO stated that “Patients who had mild or asymptomatic COVID‑19 have low levels of neutralizing antibodies (or even undetectable levels)” and that “Recent studies have shown that neutralizing antibodies may disappear after 3 months”. The lack of conclusive evidence and the spread of discouraging information provoke that in periods of growing interest toward the term “Immunization”, health influencers’ social media activity, in particular the WHO, impact negatively the energy sector. Although the interaction effect between the CDC-RT and the term “Immunization” does not appear to be significant, the directionality of the estimates confirm the negative connotation of this term.
Table 3
This table presents estimates of different regression models explaining the relationship between the energy sector and the social media activity, measured by daily volume of Retweets, of the CDC, WHO, and D. Trump from January 7, 2020 up to September 25, 2020
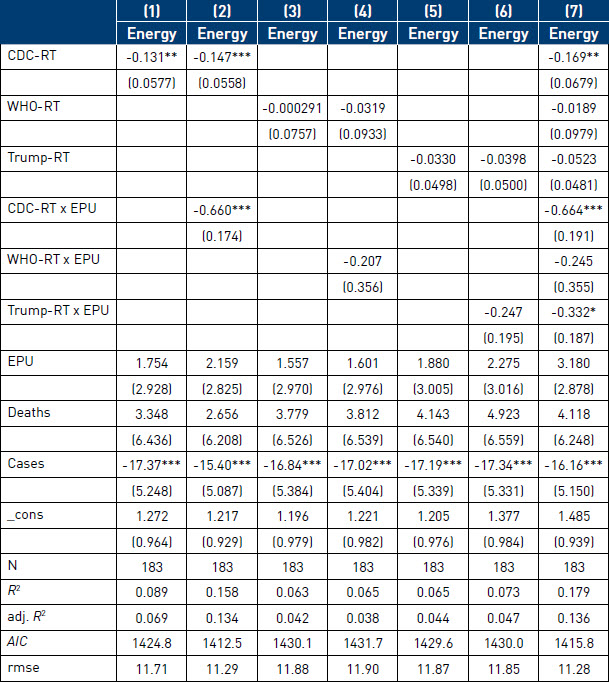
Standard errors in parentheses. * p<0.1, ** p<0.05, *** p<0.01
Table 4
This table presents estimates of different regression models explaining the relationship between the energy sector and the social media activity, measured by daily volume of Likes, of the CDC, WHO, and D. Trump from January 7, 2020 up to September 25, 2020

Standard errors in parentheses. * p<0.1, ** p<0.05, *** p<0.01
Table 6-model (2) and (4) present the interaction between the SVI to the term “Vaccine” and the social media activity of the CDC and the WHO, respectively. A traditional pathway to develop a vaccine requires a series of well regulated steps including the pre-clinical development phase, clinical trials phase I, II and III up to market registration which takes on average over 10 years, see Pronker et al. (2013). The pandemic has triggered a global race to find a vaccine against the disease and accelerated the process under the emergency use protocol. Given the unprecedented scope and magnitude of the global pandemic, countries, universities and pharmaceuticals around the world were using different technologies, drugs, and candidate vaccines to stop the spread of the virus. The outlook of a prospect vaccine by early 2021 combined with the promising early results of some potential coronavirus vaccine candidates generate an optimistic and positive connotation of the term “Vaccine”. Table 6-model (2) and (4) show that given the positive and scientific connotation, when the public attention to the term “Vaccine” increases, we observe a highly significant and positive impact of the health influencers’ social media activity. The results suggest that when the public attention to medical-related topics, such as vaccine, increases, we might expect a dominant role within the health community.
Structural VAR
In this section we aim to decompose the observed variance and assess the relative contribution of the public attention variability and shocks in explaining the energy sector dynamics at different time horizons. To do so, we implement a structural VAR approach to decompose the observed variance and measure the sector response to different shocks.
A structural VAR model can be expressed in a VAR reduced form as
where εt is a vector of innovations with εt ~ N(0,∑) and it is related to a vector of orthogonalized disturbances, et, through the linear relationship
where A and B are invertible matrices of parameters, et ~ N(0,I) and E(et. es') = 0 for all t ≠ s. For a thorough sVAR description we recommend Amisano and Giannini (1997).
Table 7 presents the variance decomposition in terms of relative importance attributed to idiosyncratic, SVI, Influencers and environmental shocks at 1 to 8 days horizons. Figure 7, on the other hand, graphically represents the variance decomposition evolution and shows how much a shock to one variable impacts the energy sector forecast error variance over time. Hardly surprising, idiosyncratic shocks represent the main source of variability at the initial period, but as time passes, the persistent effect of an idiosyncratic shock tends to decrease rapidly. Public attention shocks (SVI + Influencers), on the other hand, represent a quota of 36% of the energy sector forecast error variance at the initial period, but in contrast to idiosyncratic shocks, as time passes, the effect of public attention shocks increases sharply becoming the major contributors to the energy sector dynamics. The aforementioned results have major implications and should not be taken lightly, not only public attention shocks are a major source of variability in the energy sector but also the impact is persistent over time.
Table 5
This table presents estimates of different regression models explaining the relationship between the energy sector and the interaction effect between the search volume interest to “Coronavirus” and “Lockdown”, and the social media activity of the CDC, WHO, and D. Trump from January 7, 2020 up to September 25, 2020

Standard errors in parentheses. * p<0.1, ** p<0.05, *** p<0.01
Table 6
This table presents estimates of different regression models explaining the relationship between the energy sector and the interaction effect between the search volume interest to “Vaccine” and “Immunization”, and the social media activity of the CDC, WHO, and D. Trump from January 7, 2020 up to September 25, 2020

Standard errors in parentheses. * p<0.1, ** p<0.05, *** p<0.01
Table 7
This table presents the forecast-error variance decomposition of the energy sector from January 7, 2020 up to September 25, 2020

Figure 7
Forecast-error variance decomposition of the energy sector at 1 to 8 periods horizon

Discussion and conclusion
The COVID‑19 pandemic has triggered the worst health crisis in recorded history. The fear of community transmission, the uncertain transmission rate and routes during the first wave of the outbreak, both key elements to the epidemic control, and the threat of an eventual collapse of the health system infrastructure, led governments all over the world to close borders, implement different social distancing policies ranging from sanitary measures to strict nationwide quarantine and non-essential business lockdown. The global health and economic outlook and the politicization of the disease polarized the public opinion and created a fertile ground for the dissemination of misleading information and fake news, mostly propagated through social media platforms.
The objective of this paper is to study the relationship between the energy sector and different dimensions of public attention during the global pandemic. Although we focus the study on the energy sector, we acknowledge the impact of the COVID‑19 pandemic on other industries and we encourage future research on this matter. First, we analyze how the search volume interest to certain pandemic-related trending topics impact the energy sector. We find that the aggregated search volume interest explains 36.1% of the energy sector variability during the first wave of the outbreak, this result confirms and validates the hypothesis that the public attention toward the COVID‑19 pandemic has a significant impact on the energy industry (Hypothesis 1.a). From the pool of topics, “Coronavirus” exhibits negative and highly significant estimates and turns out to explain 27.1% of the total variation. Furthermore, our findings suggest that during periods of growing economic policy uncertainty the search interest toward “Coronavirus” has a stronger negative effect on the energy sector (Hypothesis 1.b). These findings help us to understand and identify those periods when the public attention is particularly sensitive and policy announcements might have a deeper impact.
Secondly, we study the social media activity of influencers within the health and policymaker community, and analyze the relationship with the energy sector during the pandemic. We take Twitter as the main channel of communication, and considering Retweets and Likes as mechanisms to propagate and validate a message, we analyze the influence of the CDC, WHO and D. Trump (Hypothesis 2). Our findings suggest that, as the leading public health agency in the US and global health influencer, the CDC plays an influential role during the coronavirus health crisis. Surprisingly, the results indicate a sparse impact of the WHO, which might be strongly linked to the public image deterioration and falloff in credibility experienced during the pandemic. Further, studying the two-way interaction effect between Google Search Interest and influencers social media activity, we observe that, given the positive and scientific connotation, when the public attention to the term “Vaccine” increases, health influencers—both the CDC and WHO—positively impact the energy sector. On the other hand, when the public attention toward “Coronavirus” increases the social media activity of D. Trump becomes particularly relevant and negative (Hypothesis 3). In this regard, we strongly advocate policymakers to carefully define a communication strategy timing the public attention sentiment.
Finally, we implement a structural VAR approach to decompose the observed variance and measure the energy sector response to different shocks. We find that shocks in the public attention not only represent major contributors to the energy sector dynamic but also the impact tends to increase over time suggesting a persistent effect. Hence, undermining the importance of the public attention and a proper communication strategy might cause a pronounce and persistent impact in the energy sector.
The results obtained in this study have important policy implications. Understanding the public attention and social media dynamics, especially during periods of uncertainty and turmoil, is instrumental to efficiently implement a policy strategy, develop a sustainable energy transition and design a long-term policy architecture. Moreover, the findings presented in this paper also shed some light on the role that health and policymaker influencers play during the outbreak and the propagation of misleading information through social media platforms.
Appendices
Acknowledgements
The authors are very grateful to the editors Chantale Mailhot and Yan Cimon, and two anonymous referees for their truly helpful comments and suggestions over the previous versions of the paper.
Biographical notes
Federico Platania is professor and researcher at the Institut Supérieur de Gestion, Paris. Federico holds a PhD in Quantitative Finance and Banking jointly offered by the University Complutense of Madrid, University of the Basque Country, University of Valencia, and University of Castilla la Mancha. During his academic career, Federico has received several fellowships as the one granted by the Vice-council of science and technology of Castilla la Mancha, the FPU fellowship program granted by the Spanish Ministry of Education. In addition, Federico has also participated in different projects composed of prestigious international researchers and has presented his researcher papers in several international conferences.
Celina Toscano Hernandez is professor in Law at ISC Grande Ecole Paris and PhD candidate at Cergy Paris Université. Her research interests include International Law, Social media and Public opinion, among others. During her professional career, Celina has worked in international companies such as AENA international and Accelya Holding World.
Note
Bibliography
- Amisano, G., Giannini, C., 1997. Topics in Structural VAR Econometrics. New York: Springer
- Baker, S. R., Bloom, N., Davis, S.J. 2016. Measuring Economic Policy Uncertainty, The Quarterly Journal of Economics 131(4), pp 1593–1636
- Bollen, J., Mao, H., Zeng, X., 2011. Twitter mood predicts the stock market. Journal of Computational Science 2 (1), 1–8
- Boyd, D., Golder, S., Lotan, G., 2010. Tweet, Tweet, Retweet: Conversational Aspects of Retweeting on Twitter. 2010 43rd Hawaii International Conference on System Sciences, Honolulu, HI
- Brennen, J. S., Simon, F. M., Howard, P. N., Nielsen, R. K. 2020. Types, Sources, and Claims of COVID‑19 Misinformation. University of Oxford
- Cha, M., Haddadi, H., Benevenuto, F., Gummadi, K.P. 2010. Measuring user influence in Twitter: The million follower fallacy, in: Proc. of AAAI
- Chen, D., Hu, H., & Zheng, M. 2021. How Does Energy Production Respond to the COVID‑19 Pandemic? Evidence From China. Asian Economics Letters, 2(2)
- Crider J. COVID‑19 Bankrupts 19 Energy (Oil&Gas) Companies (August 5, 2020). https://cleantechnica.com/2020/08/05/COVID‑19-bankrupts-19-energy-oil-gas-companies/
- Dredze, M., Broniatowski, D. A., Hilyard, K. M. 2016. Zika vaccine misconceptions: A social media analysis. Vaccine, 34(30), 3441-3442
- Fu, M., Shen, H. 2020. COVID‑19 and Corporate Performance in the Energy Industry. Energy Research Letters, 1(1)
- George, J., and Leidner, D. 2019. From clicktivism to hacktivism: Understanding digital activism. Information and Organization 29 (2019) 100249
- Geva, H., Oestreicher-Singer, G., Saar-Tsechansky, M. 2019. Using Retweets When Shaping Our Online Persona: Topic Modeling Approach. MIS Quarterly, 43 (2), pp 501–524
- Guo, Jianfeng and Ji, Qiang, 2013. How Does Market Concern Derived from the Internet Affect Oil Prices?. Applied Energy, 112, 1536–1543
- Han, Liyan & Lv, Qiuna & Yin, Libo., 2017. Can Investor Attention Predict Oil Prices?. Energy Economics, 66 C, pp 547–558
- Holmes K. V. (1999). CORONAVIRUSES (CORONAVIRIDAE). Encyclopedia of Virology, 291–298
- Martínez Torres, M.d.R., Toral, S.L. y Olmedilla Fernández, M., 2015. A quantitative study of the evolution of open source software communities. World Academy of Science, Engineering and Technology, 9 (6), 1374–1379
- Mastropietro, P., Rodilla, P., Batlle, C., 2020. Emergency Measures to Protect Energy Consumers During the COVID‑19 Pandemic: A Global Review and Critical Analysis, Energy Research & Social Science, 68, 101678
- Mejia, J. and Ramaprasad, J., 2020. Fact-Checking Impacts Social Perception but is Prey to Gender and Racial Discrimination (September 1, 2020). Kelley School of Business Research Paper No. 19–29
- Mora, L., Kummitha, R., Esposito, G. 2020. Digital technology deployment and pandemic control: how sociomaterial arrangements and technological determinism undermine virus containment measures
- Moravec, P., Minas, R., Dennis, A. 2019. Fake News on Social Media: People Believe What They Want to Believe When it Makes No Sense At All. MIS Quarterly, 43 (4), pp 1343–1360
- IEA (2020) Oil Market Report-April 2020, IEA, Paris https://www.iea.org/reports/oil-market-report-april-2020
- IEA (2020) Oil Market Report-August 2020, IEA, Paris https://www.iea.org/reports/oil-market-report-august-2020
- IEA (2020) Oil Market Report-September 2020, IEA, Paris https://www.iea.org/reports/oil-market-report-september-2020
- Kim, A. and Dennis, AR. 2019. Says Who? The Effects of Presentation Format and Source Rating on Fake News in Social Media. MIS Quarterly, 43 (3), pp 1025–1039
- Kirilenko, A.P., Molodtsova, T., & Stepchenkova, S. (2015). People as sensors: Mass media and local temperature influence climate change discussion on Twitter. Global Environmental Change, 30, pp 92–100
- Li, Xin and Ma, Jian and Wang, Shouyang and Zhang, Xun. (2015). How does Google search affect trader positions and crude oil prices?. Economic Modelling. 49, pp 162–171
- Loureiro, M. and Alló, M. (2020). Sensing climate change and energy issues: Sentiment and emotion analysis with social media in the U.K. and Spain. Energy Policy 143, 111490
- Oh, O., Manish, A., Raghav, HR. 2013. Community Intelligence and Social Media Services: A Rumor Theoretic Analysis of Tweets during Social Crises. MIS Quarterly, 37 (2), pp 407–426
- Perrin, A., 2015. Social Networking Usage: 2005–2015. Pew Research Center. October 2015.
- Platania, F., Toscano Hernandez, C., Arreola, F., 2022. Social media communication during natural disasters and the impact on the agricultural market. Technological Forecasting & Social Change, 179 (2022), 121594
- Pronker, E. S., Weenen, T. C., Commandeur, H., Claassen, E. H. J. H. M., Osterhaus, A.D.M.E. 2013. Risk in Vaccine Research and Development Quantified. PLoS ONE 8(3)
- Reuter, C., Kaufhold, M. A., 2018. Fifteen years of social media in emergencies: A retrospective review and future directions for crisis informatics. Journal of Contingencies and Crisis Management, 26(1), 41–57
- Rouleau, J., Gosselin, L., 2021. Impacts of the COVID‑19 lockdown on energy consumption in a Canadian social housing building. Applied Energy, 287, 116565
- Russel, M. G., Flora, J., Strohmaier, M., Poeschko, J., Perez, R., Rubens, N. 2011. Semantic Analysis of Energy-Related Conversations in Social Media: A Twitter Case Study. in International Conference on Persuasive Technology (S. 0-0)
- Shaikh I. 2022. Impact of COVID-19 pandemic on the energy markets. Economic Change and Restructuring 55, pp 433–484
- Sharif, A., Aloui, C., Yarovaya, L. 2020. COVID‑19 pandemic, oil prices, stock market, geopolitical risk and policy uncertainty nexus in the US economy: Fresh evidence from the wavelet- based approach. International Review of Financial Analysis 70, 101496
- Szczygielski, J.J., Brzeszczyński, J., Charteris, A., Bwanya, P.R. 2021. The COVID‑19 storm and the energy sector: The impact and role of uncertaint. Energy Economics 105258
- Tasnim, S., Hossain, M. M., Mazumder, H. 2020. Impact of rumors or misinformation on coronavirus disease (COVID‑19) in social media. Journal of Preventive Medicine and Public Health 53(3)
- Werth, A., Gravino, P., Prevedello, G. (2021). Impact analysis of COVID‑19 responses on energy grid dynamics in Europe. Applied Energy 281 (2021) 116045
Appendices
Notes biographiques
Federico Platania est professeur à l’Institut Supérieur de Gestion de Paris. Federico est titulaire d’un doctorat en banque et finance quantitative proposé conjointement par l’Université Complutense de Madrid, l’Université du Pays basque, l’Université de Valence et l’Université de Castilla la Mancha. Au cours de sa carrière universitaire, Federico a reçu plusieurs bourses telles que celle accordée par le vice-ministère des sciences et de la technologie de Castilla la Mancha, le programme de bourses FPU accordé par le ministère espagnol de l’éducation. En outre, Federico a également participé à différents projets composés de chercheurs internationaux prestigieux et a présenté ses travaux lors de diverses conférences internationales.
Celina Toscano Hernandez est professeur de droit à l’ISC Grande Ecole Paris et doctorante à Cergy Paris Université. Ses intérêts de recherche incluent le droit international, les médias sociaux et l’opinion publique, entre autres. Au cours de sa carrière professionnelle, Celina a travaillé dans des entreprises internationales telles que AENA international et Accelya Holding World.
Appendices
Notas biograficas
Federico Platania es profesor en el Institut Supérieur de Gestion, París. Federico posee un doctorado en Banca y Finanzas Cuantitativas ofrecido conjuntamente por la Universidad Complutense de Madrid, la Universidad del País Vasco, la Universidad de Valencia y la Universidad de Castilla la Mancha. Durante su carrera académica, Federico ha recibido varias becas como la otorgada por la Viceconsejería de Ciencia y Tecnología de Castilla la Mancha, el programa de becas FPU otorgado por el Ministerio de Educación español. Además, Federico también ha participado en diferentes proyectos integrados por prestigiosos investigadores internacionales y ha presentado sus trabajos en varios congresos internacionales.
Celina Toscano Hernandez es profesora de Derecho en ISC Grande Ecole Paris y doctoranda en Cergy Paris Université. Sus intereses de investigación incluyen Derecho Internacional, Redes Sociales y Opinión Pública, entre otros. Durante su carrera profesional, Celina ha trabajado en empresas internacionales como AENA internacional y Accelya Holding World.
List of figures
Figure 1
Cumulative confirmed Cases and Deaths in the US up to September 25, 2020
Figure 2
Economic Policy Uncertainty in the US from Janyary 7, 2020 up to September 25, 2020
Figure 3
Google search volume interest evolution from Janyary 7, 2020 up to September 25, 2020
Figure 4
Centers for Disease Control and Prevention Twitter activity from Janyary 7, 2020 up to September 25, 2020
Figure 5
World Health Organization Twitter activity from Janyary 7, 2020 up to September 25, 2020
Figure 6
Donald Trump Twitter activity from Janyary 7, 2020 up to September 25, 2020
Figure 7
Forecast-error variance decomposition of the energy sector at 1 to 8 periods horizon
List of tables
Table 1
Descriptive statistics
Table 2
This table presents estimates of different regression models explaining the relationship between the energy sector and the public attention to “COVID‑19”, “Coronavirus”, “Lockdown”, “Vaccine”, and “Immunization” from January 7, 2020 up to September 25, 2020
Standard errors in parentheses.
* p<0.1, ** p<0.05, *** p<0.01
Table 3
This table presents estimates of different regression models explaining the relationship between the energy sector and the social media activity, measured by daily volume of Retweets, of the CDC, WHO, and D. Trump from January 7, 2020 up to September 25, 2020
Standard errors in parentheses. * p<0.1, ** p<0.05, *** p<0.01
Table 4
This table presents estimates of different regression models explaining the relationship between the energy sector and the social media activity, measured by daily volume of Likes, of the CDC, WHO, and D. Trump from January 7, 2020 up to September 25, 2020
Standard errors in parentheses. * p<0.1, ** p<0.05, *** p<0.01
Table 5
This table presents estimates of different regression models explaining the relationship between the energy sector and the interaction effect between the search volume interest to “Coronavirus” and “Lockdown”, and the social media activity of the CDC, WHO, and D. Trump from January 7, 2020 up to September 25, 2020
Standard errors in parentheses. * p<0.1, ** p<0.05, *** p<0.01
Table 6
This table presents estimates of different regression models explaining the relationship between the energy sector and the interaction effect between the search volume interest to “Vaccine” and “Immunization”, and the social media activity of the CDC, WHO, and D. Trump from January 7, 2020 up to September 25, 2020
Standard errors in parentheses. * p<0.1, ** p<0.05, *** p<0.01
Table 7
This table presents the forecast-error variance decomposition of the energy sector from January 7, 2020 up to September 25, 2020